
mcpprof
v0.1.1
Published
Transparent STDIO proxy that profiles MCP agent sessions — per-tool latencies, error rates, message counts.
Maintainers
 jakesilverman
Readme
mcpprof
A transparent STDIO proxy that profiles MCP (Model Context Protocol) agent sessions. See exactly what tools your AI agent calls, how long each takes, and where errors happen.
Think strace for MCP.
Demo
The Problem
When you're building or debugging MCP servers, you're flying blind. You know the AI called something, but you can't see the actual message flow, don't know which tools are slow, and can't tell if errors are client-side or server-side. MCP Inspector lets you manually test servers, but there's nothing that instruments real sessions between a real client and server.
How It Works
mcpprof sits between any MCP client (Claude Code, Cursor, VS Code) and any MCP server. It intercepts all JSON-RPC messages flowing over STDIO, timestamps them, matches request/response pairs by ID to calculate per-tool latencies, and prints a performance report when the session ends.
MCP Client ──stdin──▸ [mcpprof] ──stdin──▸ MCP Server
MCP Client ◂──stdout── [mcpprof] ◂──stdout── MCP Server
                         │
                    stderr: live log
                    + session report
The proxy is completely transparent — the client and server don't know it's there. Reports go to stderr so they never interfere with the MCP protocol on stdout.
Install
npx mcpprof -- <your-server-command>
# or
npm install -g mcpprof
Usage
# Basic: wrap any MCP server
mcpprof -- node my-mcp-server.js
# Live mode: see messages as they flow
mcpprof --live -- python server.py
# Save JSON report
mcpprof --output report.json -- npx @modelcontextprotocol/server-filesystem /tmp
# Quiet mode: just the report, no live output
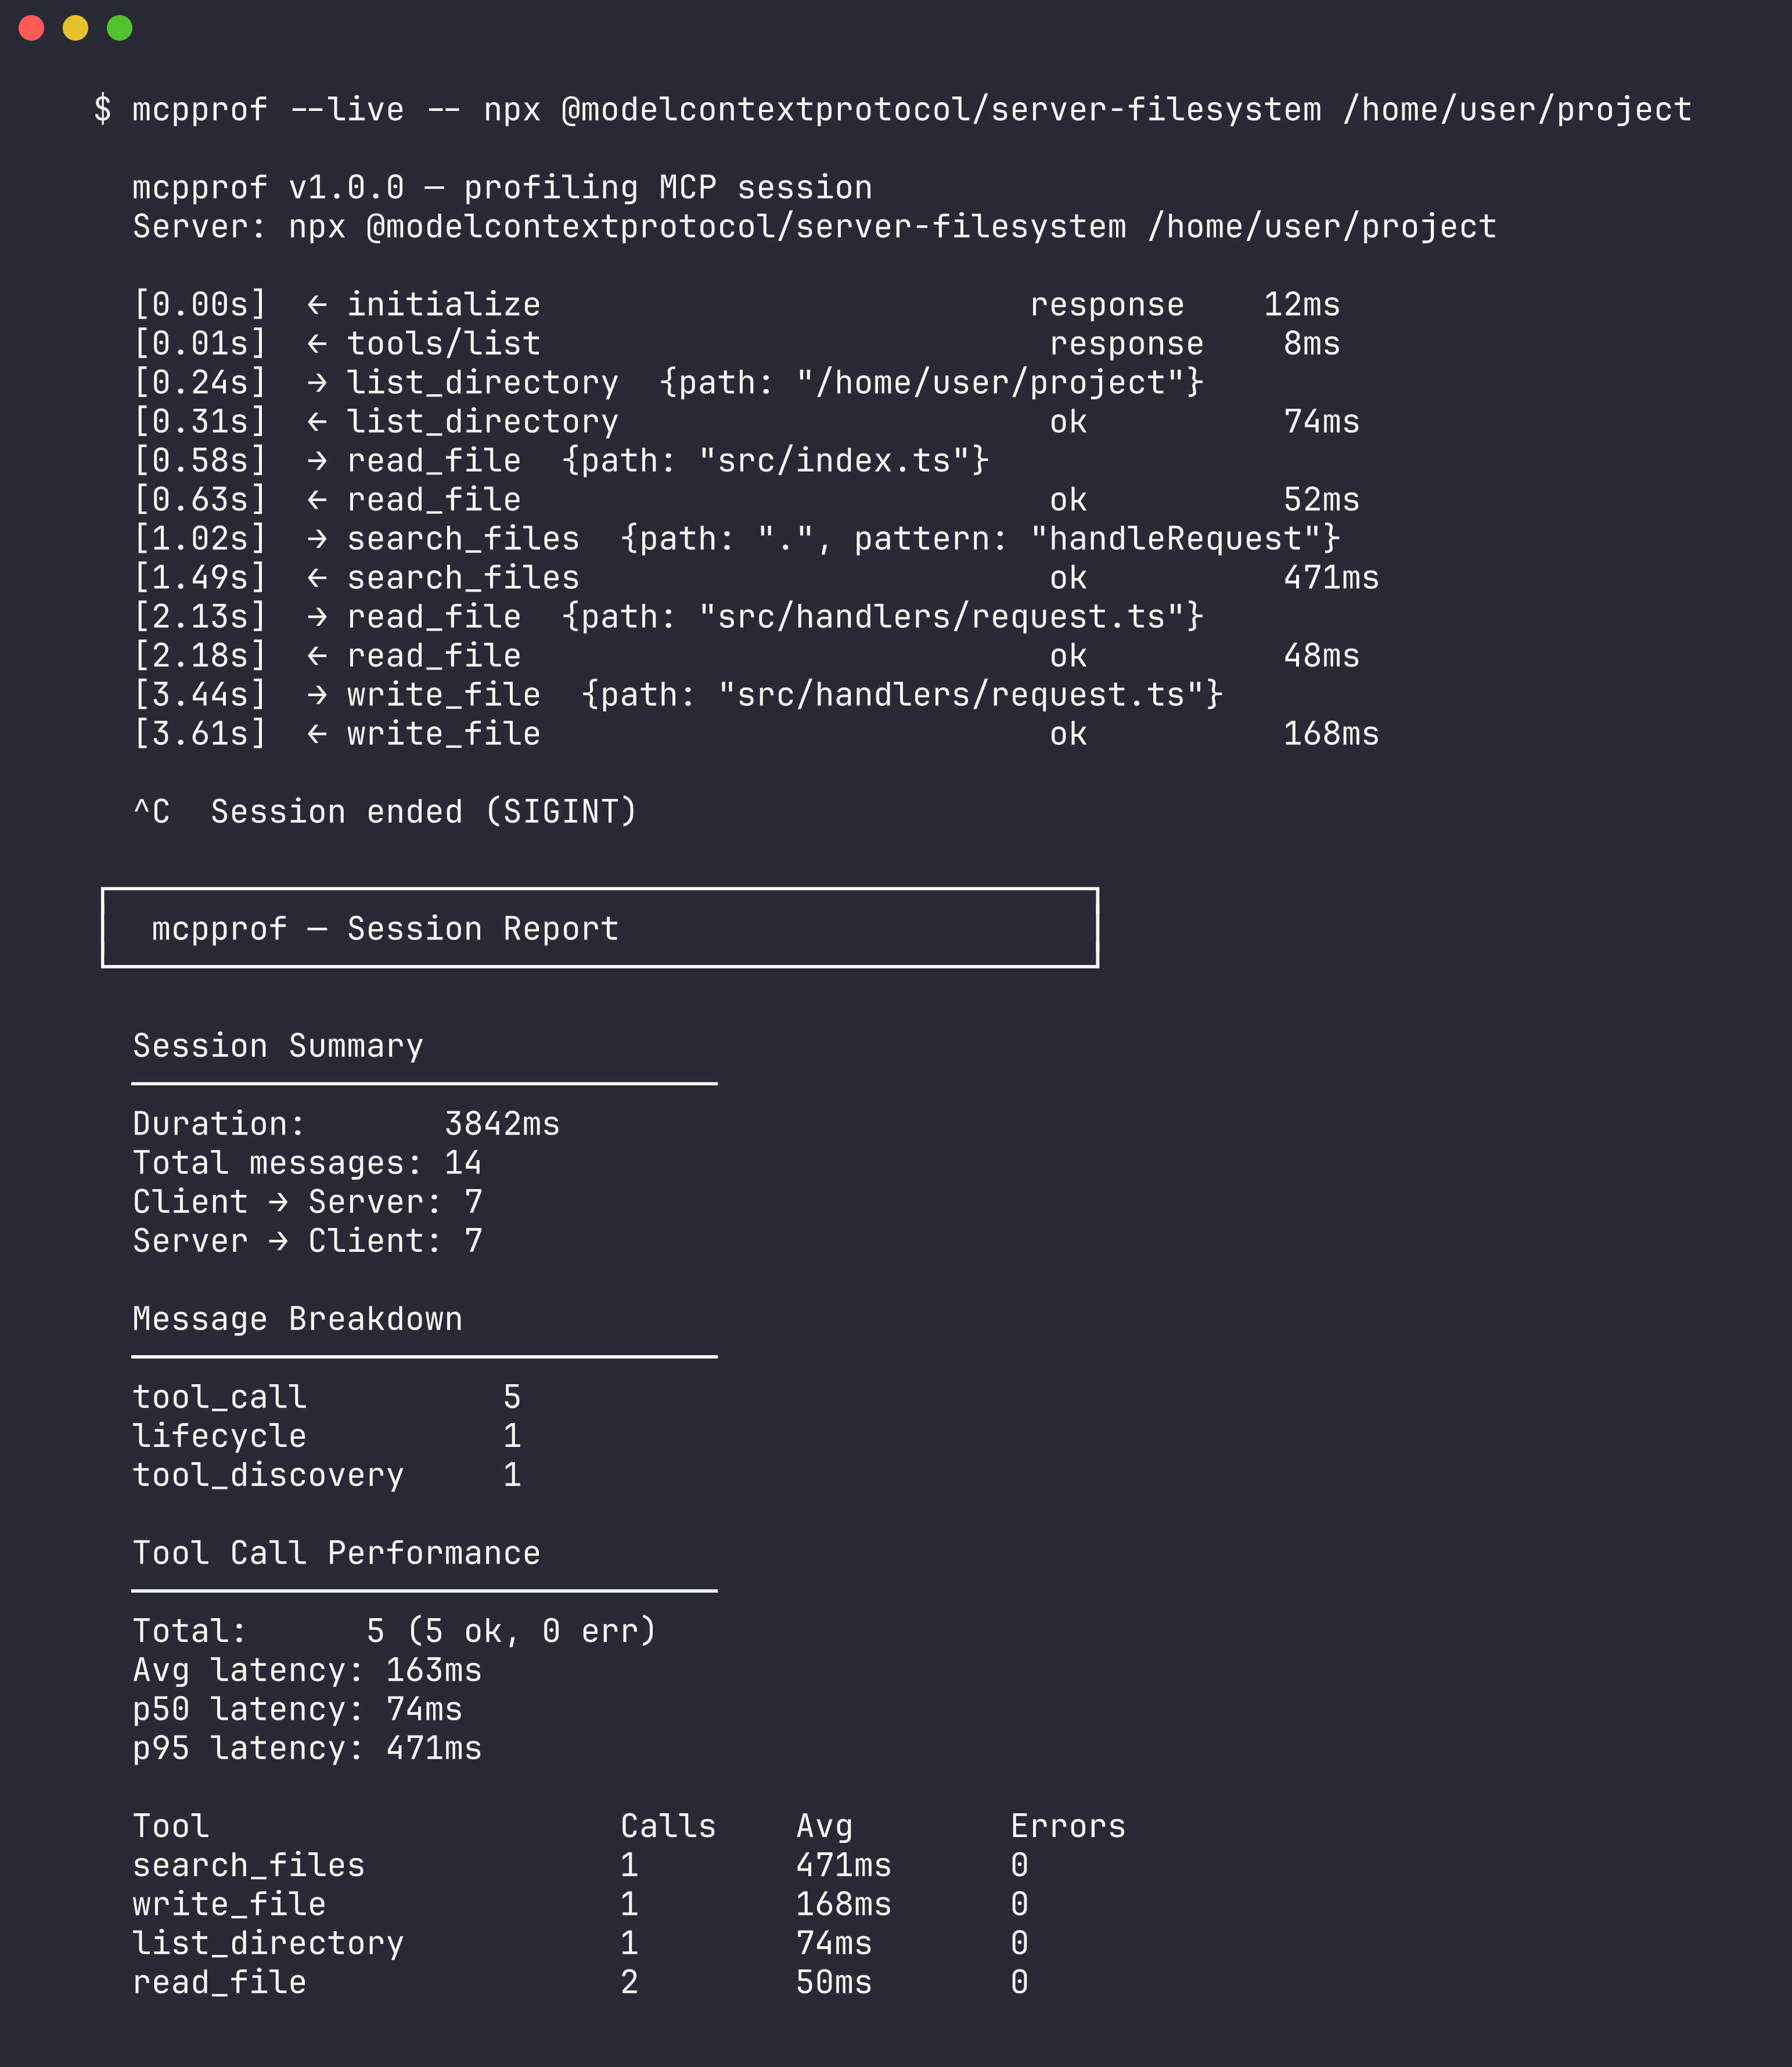
mcpprof --quiet -- node server.jsOutput
┌──────────────────────────────────────────────────┐
│  mcpprof — Session Report
└──────────────────────────────────────────────────┘

  Session Summary
  ──────────────────────────────
  Duration:       4200ms
  Total messages: 17
  Client → Server: 9
  Server → Client: 8

  Message Breakdown
  ──────────────────────────────
  tool_call          5
  lifecycle          2
  tool_discovery     1
  notification       1

  Tool Call Performance
  ──────────────────────────────
  Total:      5 (4 ok, 1 err)
  Avg latency: 46ms
  p50 latency: 42ms
  p95 latency: 58ms

  Tool                     Calls    Avg        Errors
  search                   3        52ms       0
  read_file                2        35ms       1
Tech Stack
- TypeScript, Node.js
- Zero runtime dependencies (uses only Node stdlib: child_process, readline, events, fs)
- Works with any MCP server that uses STDIO transport
The Hard Part
Matching async JSON-RPC request/response pairs. MCP messages can arrive in any order — a client sends requests with IDs 1, 2, 3 and responses might come back 2, 1, 3. Notifications (no ID) arrive mixed in. The profiler tracks pending requests in a Map keyed by ID, calculates latency when the matching response arrives, and reports unmatched requests as timeouts at session end.
License
MIT