
microsoft-office-add-in-debugger
v0.0.3
Published
Debug your Desktop Office Taskpane Add-ins in VS Code.
Downloads
18
Maintainers
 ms-office
Readme
Microsoft Office Add-in Debugger for Visual Studio Code
The "Microsoft Office Add-in Debugger" Extension for Visual Studio Code allows you to use F5 to debug your Office Add-in against the Edge runtime.
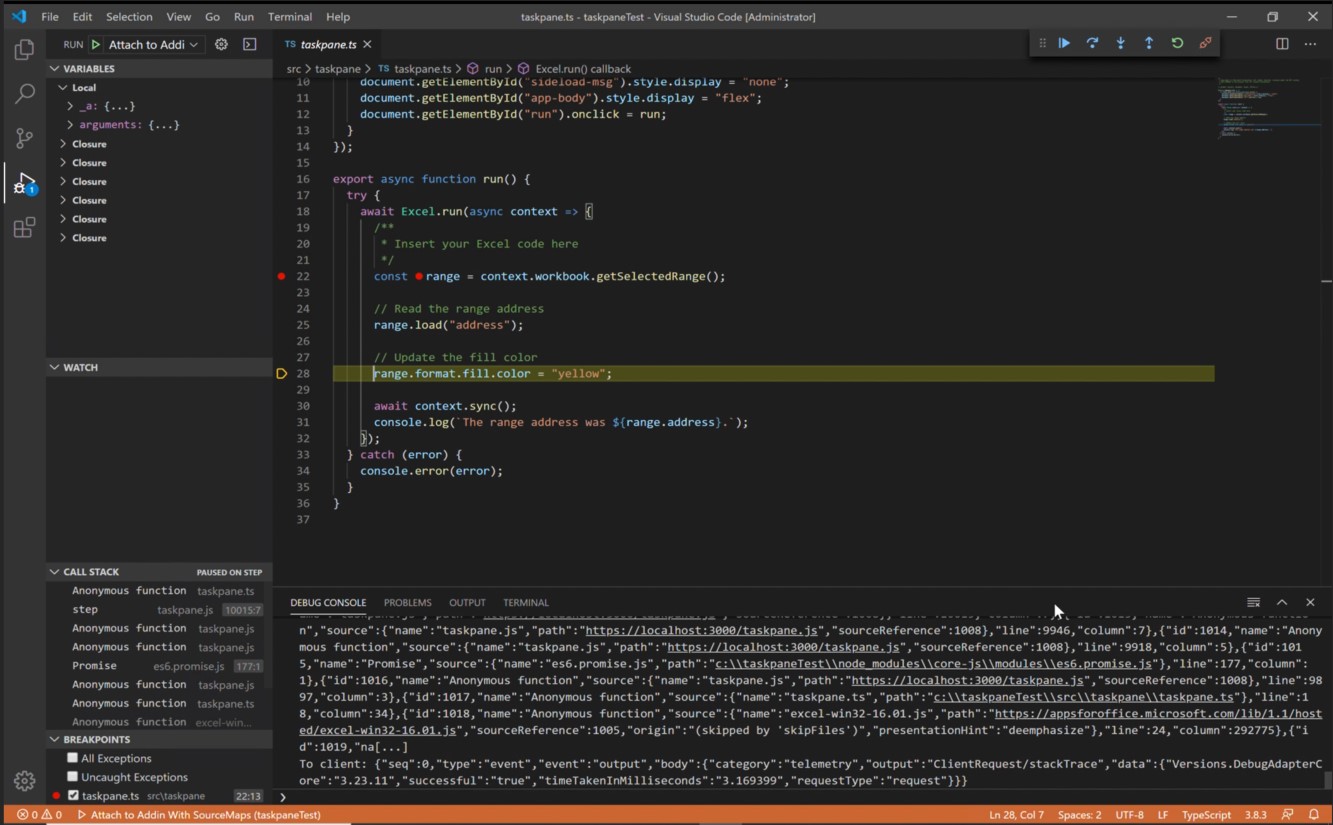
This debugging mode is dynamic, allowing you to set breakpoints while code is running. You can see changes in your code immediately while the debugger is attached, all without losing your debugging session. Your code changes also persist, so you can see the results of multiple changes to your code. The following image shows this extension in action.
Prerequisites
- Visual Studio Code (must be run as an administrator)
- Node.js (version 10+)
- Windows 10
- Microsoft Edge (Not Chromium)
- Yo Office, if you need to create a new project
These instructions assume you have experience using the command line, understand basic JavaScript, and have created an Office add-in project before using the Yo OfficeDev/ generator-office).
Install and use
If you do not already have a project to work with, create a new project with the latest version of Yo Office. If you already have a project you would like to use, there is no need to create a new one.
Open a command prompt as administrator
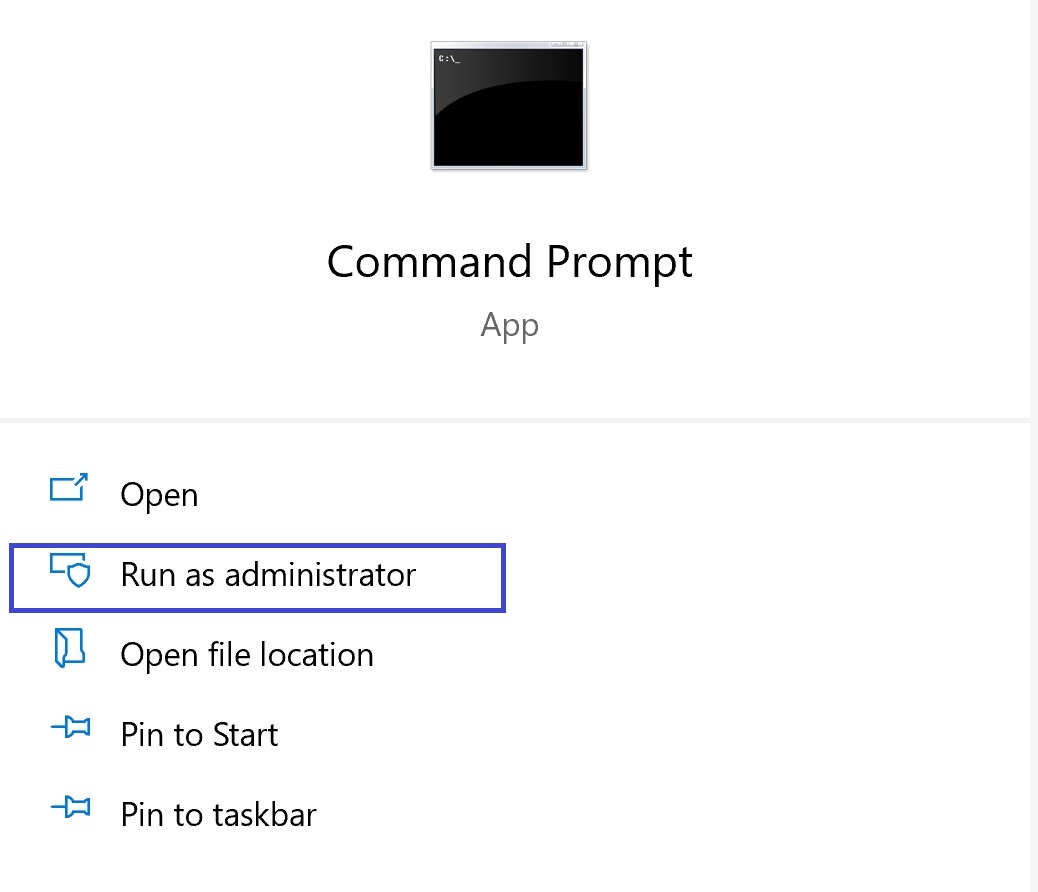
To open Visual Studio Code as an administrator, select the run as administrator option when opening Visual Studio Code after searching for it in Windows.
Navigate to your project directory.
Run the following command to open your project in Visual Studio Code as an administrator
code .Once Visual Studio Code is open, navigate manually to the project folder.
To open Visual Studio Code as an administrator, select the run as administrator option when opening Visual Studio Code after searching for it in Windows.
Within VS Code, select CTRL + SHIFT + X to open the Extensions bar. Search for the "Office Addin Debugger" extension and install it.
In the .vscode folder of your project, you will find a launch.json file. At the end of the file, add the following code to the configurations section of the file.
	    {
	    "type": "office-addin",
	    "request": "attach",
	    "name": "Attach to Office Add-ins",
	    "port": 9222,
	    "trace": "verbose",
	    "url": "https://localhost:3000/taskpane.html?_host_Info=HOST$Win32$16.01$en-US$$$$0",
	    "webRoot": "${workspaceFolder}",
	    "timeout": 45000
	    }
In the section of JSON you just copied, find the "url" section. In this URL, you will need to replace the uppercase HOST text with the host application for your Office add-in. For example, if your Office add-in is for Excel, your URL value would be "https://localhost:3000/taskpane.html?_host_Info=Excel$Win32$16.01$en-US$$$$0".
Open the command prompt and ensure you are at the root folder of your project. Run the command
npm startto start the dev server. When your add-in loads in the Office host application, open the task pane.Return to Visual Studio Code and choose View > Debug or enter CTRL + SHIFT + D to switch to debug view.
From the Debug options, choose Attach to Office Add-ins. Select F5 or choose Debug -> Start Debugging from the menu to begin debugging.
Set a breakpoint in your project's task pane file. You can set breakpoints in VS Code by hovering next to a line of code and selecting the red circle which appears.
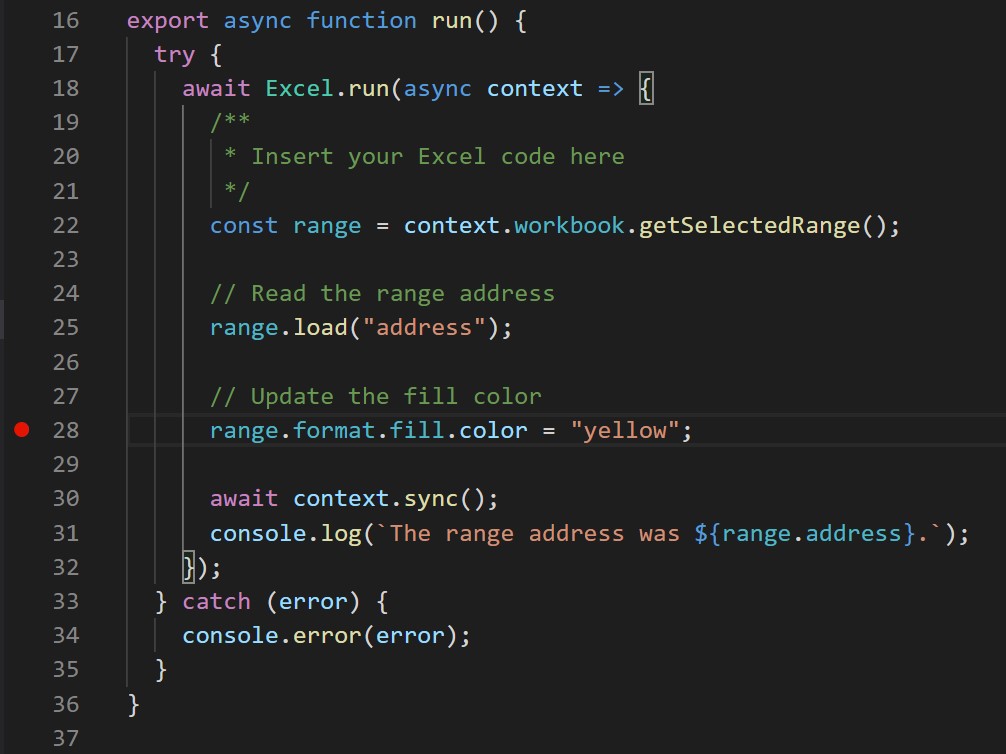
- Run your add-in. You will see that breakpoints have been hit and you can inspect local variables.
Questions and comments
We'd love to get your feedback about this sample! You can send your feedback to us in the Issues section of this repository.
Open Source Code of Conduct
This project has adopted the Microsoft Open Source Code of Conduct. For more information, see the Code of Conduct FAQ or contact [email protected] with any additional questions or comments.
Copyright
Copyright (c) 2020 Microsoft Corporation. All rights reserved.