npm package discovery and stats viewer.

Discover Tips

  • General search

    [free text search, go nuts!]

  • Package details

    pkg:[package-name]

  • User packages

    @[username]

Sponsor

Optimize Toolset

I’ve always been into building performant and accessible sites, but lately I’ve been taking it extremely seriously. So much so that I’ve been building a tool to help me optimize and monitor the sites that I build to make sure that I’m making an attempt to offer the best experience to those who visit them. If you’re into performant, accessible and SEO friendly sites, you might like it too! You can check it out at Optimize Toolset.

About

Hi, 👋, I’m Ryan Hefner  and I built this site for me, and you! The goal of this site was to provide an easy way for me to check the stats on my npm packages, both for prioritizing issues and updates, and to give me a little kick in the pants to keep up on stuff.

As I was building it, I realized that I was actually using the tool to build the tool, and figured I might as well put this out there and hopefully others will find it to be a fast and useful way to search and browse npm packages as I have.

If you’re interested in other things I’m working on, follow me on Twitter or check out the open source projects I’ve been publishing on GitHub.

I am also working on a Twitter bot for this site to tweet the most popular, newest, random packages from npm. Please follow that account now and it will start sending out packages soon–ish.

Open Software & Tools

This site wouldn’t be possible without the immense generosity and tireless efforts from the people who make contributions to the world and share their work via open source initiatives. Thank you 🙏

© 2026 – Pkg Stats / Ryan Hefner

minicanvas

v0.2.2

Published

Mini-library to quickly generate canvas images (in the browser and nodejs)

Readme

#minicanvas.js

minicanvas.js helps you to quickly build canvas renderings. It works in the browser and in node seamlessly.
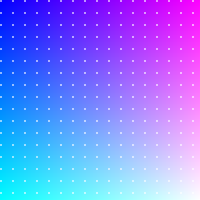
Here is an example:

MiniCanvas.create(200, 200)
  .box(function(x, y) {
    return "rgb(" + Math.round(x*255) + "," + Math.round(y*255) + ", 255)";
  })
  .dotGrid(12, 12, 1, "rgba(255,255,255,0.75)")
  .display("box");

It renders an image just like this:

box

The API is quite simple and all methods are chainable. MiniCanvas.create generates a new instance. You can then use the many drawing options available and in the end call display(name) to 'show' the result. What display does depends on the environment, if you are using minicanvas in the browser than it will attach the canvas to the DOM (by default it will append to the body but you can decide for another parent element by overwriting minicanvas.BrowserCanvas.parentNode). If the image has been rendered within nodejs then an image file will be created and stored inside the images folder (the folder name can be redefined by overwriting minicanvas.NodeCanvas.imagePath).

minicanvas.js is all about makeing it simple, saving images mean no streams or complicated setups, just give your sample a name. Images will be saved in PNG format if they are static, or Animated GIF if there is an animation involved.

Drawing API

border(weight = 1.0, ?color = #000000)

Generates a border around the canvas.

box(handler)

Paints the entire canvas point by point. handler argument must be a function that takes two arguments, x and y, with values between 0.0 and 1.0. The function must return a color in string format.

checkboard(?size = 8, ?light = #ffffff, ?dark = #cccccc)

Generates a checkboard pattern whose tiles have side size and alternate between the light and dark colors.

circle(x, y, radius, weight, ?lineColor, ?fillColor)

Draws a circle. If lineColor is passed the perimeter will be drawn with a weight of weight. If fillColor is provided the area will be filled with that color.

clear()

Clears out the entire canvas.

cross(?ox, ?oy, ?weight = 1.0, ?color)

Generates a cross shape. If no offsets (ox or oy) are provided the cross lines will be centered in the canvas area. Remember that if you want to use the default values you have to pass null values in their places.

dot(x, y, ?radius = 3, ?color)

Draws a dot at x and y coords.

dotGrid(?dx = 10.0, ?dy = 10.0, ?radius = 1.0, ?color, ?ox = 0.5, ?oy = 0.5)

Generates a grid of dots.

fill(color)

grid(?dx = 10.0, ?dy = 10.0, ?weight = 1.0, ?color, ?ox = 0.5, ?oy = 0.5)

gridHorizontal(?dy = 10.0, ?weight = 1.0, ?color, ?oy = 0.5)

gridVertical(?dx = 10.0, ?weight = 1.0, ?color, ?ox = 0.5)

gradientHorizontal(handler)

gradientVertical(handler)

line(x0, y0, x1, y1, ?weight = 1.0, ?color)

lineHorizontal(offset, ?weight = 1.0, ?color)

lineVertical(offset, ?weight = 1.0, ?color)

palette(colors : Array<Array<RGBA>>, ?padding = 2.0, ?margin = 0.0)

rect(x0, y0, x1, y1, ?weight = 1.0, ?lineColor, ?fillColor)

Animation API

animate(?x, ?y)

animateNode(?x, ?y)

animateBrowser(?x, ?y)

storeFrame(?times = 1)

Utility API

context(callback)

with(callback)

Interaction API

onClick(callback)

onDown(callback)

onMove(callback)

onTrail(callback)

onUp(callback)

offClick()

offDown()

offMove()

offTrail()

offUp()

click(x, y)

down(x, y)

move(x, y)

up(x, y)