
node-red-contrib-cpu
v0.0.4
Published
A Node Red node to monitor CPU usage
Maintainers
 bartbutenaers
Readme
node-red-contrib-cpu
A Node Red node for monitoring CPU usage
Install
Run the following npm command in your Node-RED user directory (typically ~/.node-red):
npm install node-red-contrib-cpuUsage
This node will monitor the CPU usage, based on the Node.js OS Library.
An example flow:

A trigger message should be send to the input, every time the CPU usage should be recalculated. The calculated CPU usage is the average usage since the previous calculation, so the calculated value will become more accurate when the period between successive calculations is small. As a result, it is advised to apply a trigger message every second on the input.
Single output message for overall cpu usage
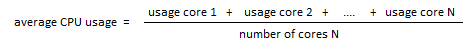
When this option is selected, a single output message will be generated that contains the overall CPU usage (with topic 'overall'). The overall CPU usage is calculated as the average usage of all cores:
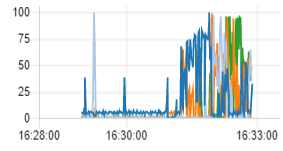
Simon Hailes adviced me to add this option, since the graphs per core can become too noisy. For example, from following graph you might conclude (incorrectly!) that video processing (using the OpenCv library) uses nicely all 4 cores of a Raspberry Pi:
However when looking at the overall CPU usage, it becomes clear that only 25% of the Raspberry Pi CPU resources is being used:
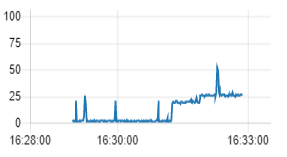
This means that the library uses all 4 available cores, but in total only 25% of the 4 cores...
There will be a single output message, containing the overall data of all cores:
msg.payloadis the overall usage percentage (sum of usage of all cores / number of cores)msg.speedis processor speed (in MHz)msg.topicis a fixed text (overall)msg.modelis the CPU model
Separate output message for each core
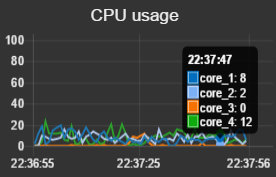
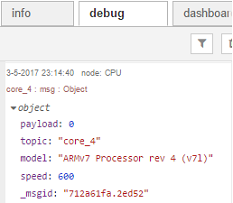
When this option is selected, an output message will be generated for each core individually. Since every core gets it's own topic (core_xxx), it becomes very easy to display all the cores in a single graph on the dashboard:
The output message for each core will look like this:
msg.payloadis the core usage (as a percentage)msg.speedis processor speed (in MHz)msg.topicis the name of the (logical) CPU core (core_xxx)msg.modelis the CPU model
This is an example of such an output message:
Single output message with array of core usages
When this option is selected, a single output message will be generated that contains an array of all CPU usages (with topic 'all_cores').
msg.payloadis the array with information of all the available cores:nameis the name of the (logical) CPU core (core_xxx)usageis the core usage (as a percentage)modelis the CPU modelspeedis the processor speed (in MHz)
msg.topicis a fixed text (all_cores)
Single output message with core temperature(s)
When this option is selected, a single output message will be generated that contains the temperature values in °C (with topic 'temperature').
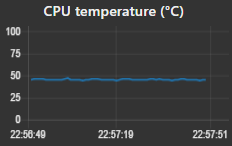
The output message will look like this:
msg.payloadis the main (average) temperaturemsg.maxis maximum temperaturemsg.coresis an array of temperatures of all coresmsg.topicis a fixed text (temperature)
CAUTION: the temperature values are not available on all systems (e.g. on Sun systems)! And on some systems the msg.cores array will be empty (e.g. on Raspberry Pi 3), but instead the main temperature might be available.
Core definition
As mentioned before, data will be outputted for every core. However what does a core represent?
In case of a system with N processors (and M cores in each processor), the total number of physical cores in the graph will be NxM.
However sometimes we will get much more virtual cores on the output (compared to the number of physical cores). This could be the case for example with processors that support Hyper threading.
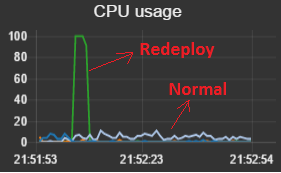
Troubleshooting
This node can be used to detect performance issues easily, without having to install extra third-party tools.
As a starting point (to compare your own CPU usage graph), a basic Node-Red flow uses very few core resources (except from the deploy period):
Alternative
The The node-red-contrib-os node also contains a 'cpus' node, which can be used to get the same kind of information. However there are some differences between both nodes:
| | node-red-contrib-os (cpus) | node-red-contrib-cpu | | ------------------ |:--------------------------------------:| :--------------------:| | Multiple cores | all in 1 msg | separate messages | | Measurement start | system startup | previous calculation | | Output value | multiple values (idle, user, sys ...) | single percentage |
Summarized the node-red-contrib-cpu node is some kind of convenience node, that takes care of all calculations in case you want to live monitor the CPU usages.