
node-red-contrib-gc
v0.0.1
Published
A Node Red node to capture garbage collection statistics
Maintainers
 bartbutenaers
Readme
node-red-contrib-gc
A Node Red node for analyzing garbage collection information in V8. That V8 is Google's Javascript engine (written in C++), that is a.o. used to run Node.js.
Install
Run the following npm command in your Node-RED user directory (typically ~/.node-red):
npm install node-red-contrib-gcUsage
This node can be used to analyse memory problems, without having to install third party tools.
The msg.payload off the output message will contain a JSON structure, with lots of GC related information:
        pause: 433034,
        pauseMS: 0,
        gctype: 1,
        before: {
            totalHeapSize: 18635008,
            totalHeapExecutableSize: 4194304,
            usedHeapSize: 12222496,
            heapSizeLimit: 1535115264
        },
        after: {
            totalHeapSize: 18635008,
            totalHeapExecutableSize: 4194304,
            usedHeapSize: 8116600,
            heapSizeLimit: 1535115264
        },
        diff: {
            totalHeapSize: 0,
            totalHeapExecutableSize: 0,
            usedHeapSize: -4105896,
            heapSizeLimit: 0
        }
Explanation of the properties in the payload:
- pause: Duration of the GC (in nanoseconds)
- pauseMS: Duration of the GC (in milliseconds)
- gctype: Type of garbage collection. Different gc types are available in V8:
- type 1: Scavenge (minor GC)
- type 2: Mark/Sweep/Compact (major GC)
- type 4: Incremental marking
- type 8: Weak/Phantom callback processing
- type 15: All
- totalHeapSize: total number of bytes V8 has allocated for the heap. This number can increase afterwards if usedHeap needs more.
- totalHeapExecutableSize: Number of bytes for compiled bytecode and JITed code
- usedHeapSize: Number of bytes used to store application data
- heapSizeLimit: The absolute (physical hardware) limit that the heap can never exceed
The msg.topic value will contain the (abbreviated) GC type description:
- Minor
- Major
- Incremental
- Weak
- All
Example flow
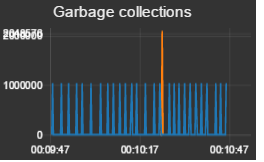
For example, let's get the amount of heap memory being freed by the garbage collector:

[{"id":"d4273bb3.2956f8","type":"gc","z":"6beebf75.ed0b5","minor":true,"major":true,"incremental":true,"weak":true,"all":true,"name":"","x":363.01171875,"y":1524.64453125,"wires":[["c79dbd16.6f388"]]},{"id":"c79dbd16.6f388","type":"function","z":"6beebf75.ed0b5","name":"Get heap size freed by GC","func":"function sendWithDelay(message) {\n node.send(message);\n}\n\n// Pass the totHeapSize difference (i.e. the amount of heap size that has been freed by the GC) and the topic to the output.\n// To get a pulse, make the signal 0 (300 msecs) before and (300 msecs) after the real value.\nsetTimeout(sendWithDelay, 0, {payload:0, topic:msg.topic});\nsetTimeout(sendWithDelay, 300, {payload:Math.abs(msg.payload.diff.totalHeapSize), topic:msg.topic});\nsetTimeout(sendWithDelay, 600, {payload:0, topic:msg.topic});","outputs":1,"noerr":0,"x":583.765625,"y":1524.5,"wires":[["f744096.dfe3af8"]]},{"id":"f744096.dfe3af8","type":"ui_chart","z":"6beebf75.ed0b5","name":"Heap freed graph","group":"1a7f6b0.0560695","order":0,"width":0,"height":0,"label":"Garbage collections","chartType":"line","legend":"false","xformat":"HH:mm:ss","interpolate":"linear","nodata":"Garbage collections","ymin":"0","ymax":"2048576","removeOlder":"1","removeOlderPoints":"","removeOlderUnit":"60","cutout":0,"x":848.375,"y":1524.75,"wires":[[],[]]},{"id":"1a7f6b0.0560695","type":"ui_group","z":"","name":"Performance","tab":"18b10517.00400b","disp":true,"width":"6"},{"id":"18b10517.00400b","type":"ui_tab","z":"","name":"Performance","icon":"show_chart"}]Based on the topic, this flow can show separate graphs for each GC type (minors in blue and majors in orange):
Node configuration
You can select which GC types should trigger a message on the output port.
Background information
Garbage collection is a complex process, and lots of information about it is available on the internet. However here some basic information to get started.
Memory graph
The main Node.js program could create a new object (on the heap memory), for example:
var myCar = new Car();Each car will have an engine, so inside the Car class other data could be allocated:
this.engine = new Engine();And so on ... This means an entire memory graph will be constructed, started from our main program (root node):
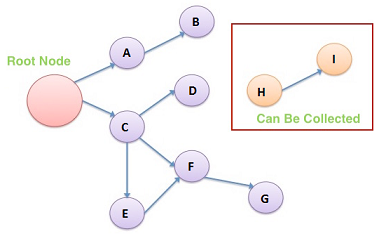
In our example A would be a Car object, and B would be an Engine object. Each of the objects can have references to other objects.
An object is needed in a program, as long as as that object can be reached (by traversing the memory graph) from the root node. If it cannot be accessed anymore from the root node, it should be deleted: like objects H and I which are unreachable.
Garbage collection
In Javascript a garbage collection system is responsible for cleaning up unreachable objects automatically, when required by the V8 engine.
The memory consumption in a normal application would look like this:
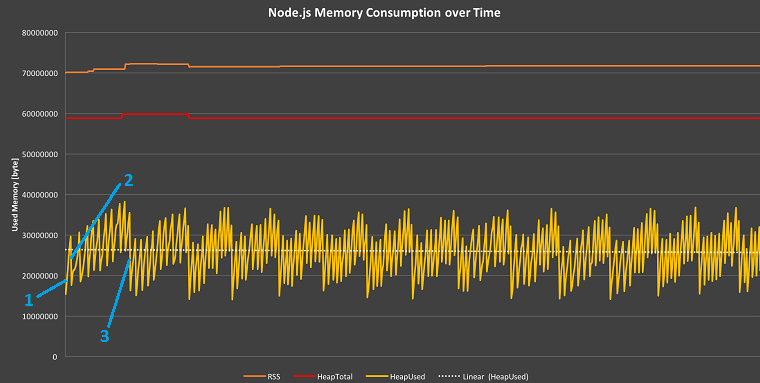
- The memory will start increasing, since the application is allocating memory (e.g. by
new Car()). - The minor garbage collection will cleanup memory, so memory consumption will decrease. A minor GC is fast (since it frees only a little bit of memory), so the system will run it very frequently.
- The major garbage collection will be started when the memory exceeds a certain limit. Such a GC is slow (since it frees much more memory), so the system will run it it less frequently.
- The entire process will repeat ... This way the memory will fluctuate between boundaries, but globally the memory consumption remains constant.
Memory leak
Under certain circumstances, the major garbage collection will not be able to free up all memory (see delta inside circle):
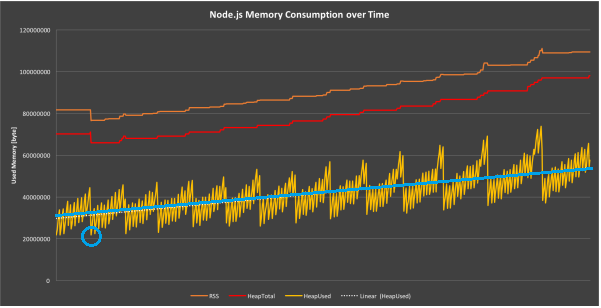
Due to this memory leak, the memory consumption will start to increase linear (see blue line). As a result, the memory consumption will evolve to 100% after some time. At that moment the application will fail, since it cannot allocate objects anymore.