
opencode-tokscope
v0.4.0
Published
Model and provider throughput comparisons for OpenCode V2.

Maintainers
 mihaellenic
Readme
opencode-tokscope



Which models and providers are fastest in your actual OpenCode usage? And are they getting faster or slower?
Tokscope is an OpenCode V2 terminal UI plugin with:
- A full-screen
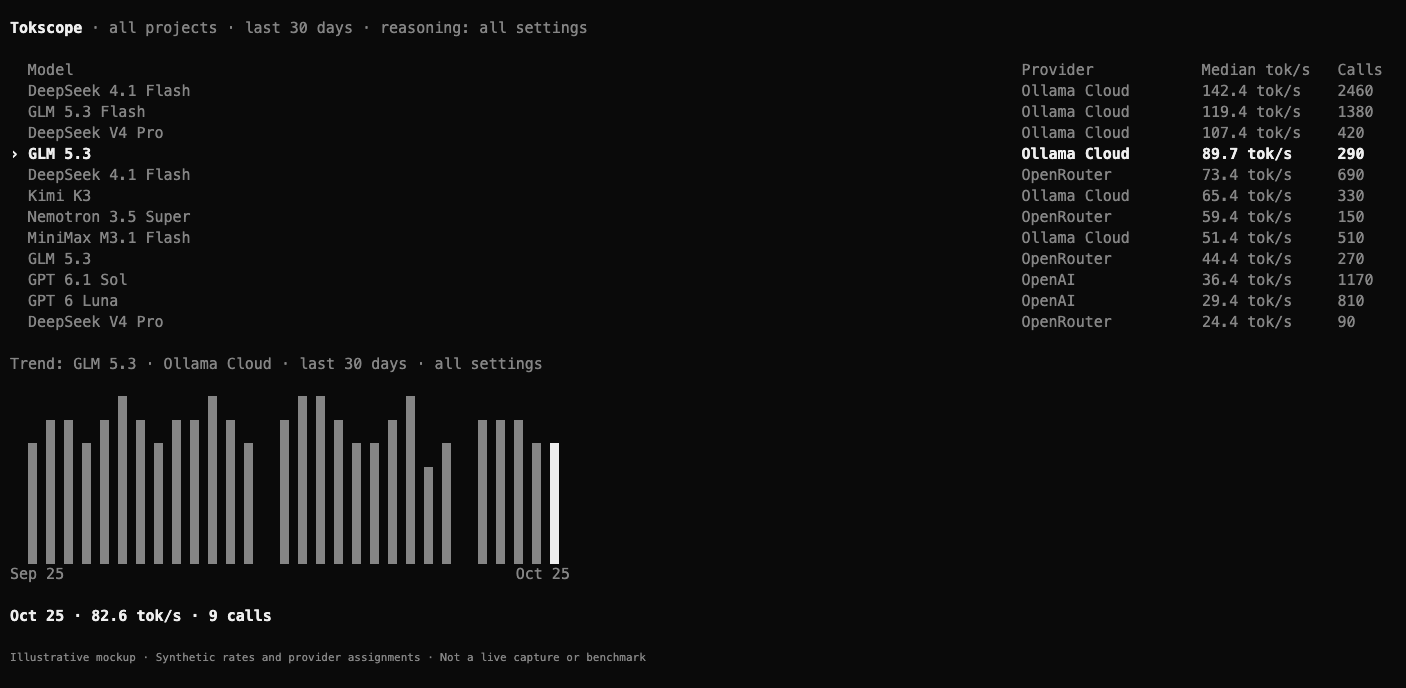
/tokscopepage comparing median tokens per second for each model/provider pair. - A daily median trend for the selected pair, with project, time-range, and reasoning-setting filters.
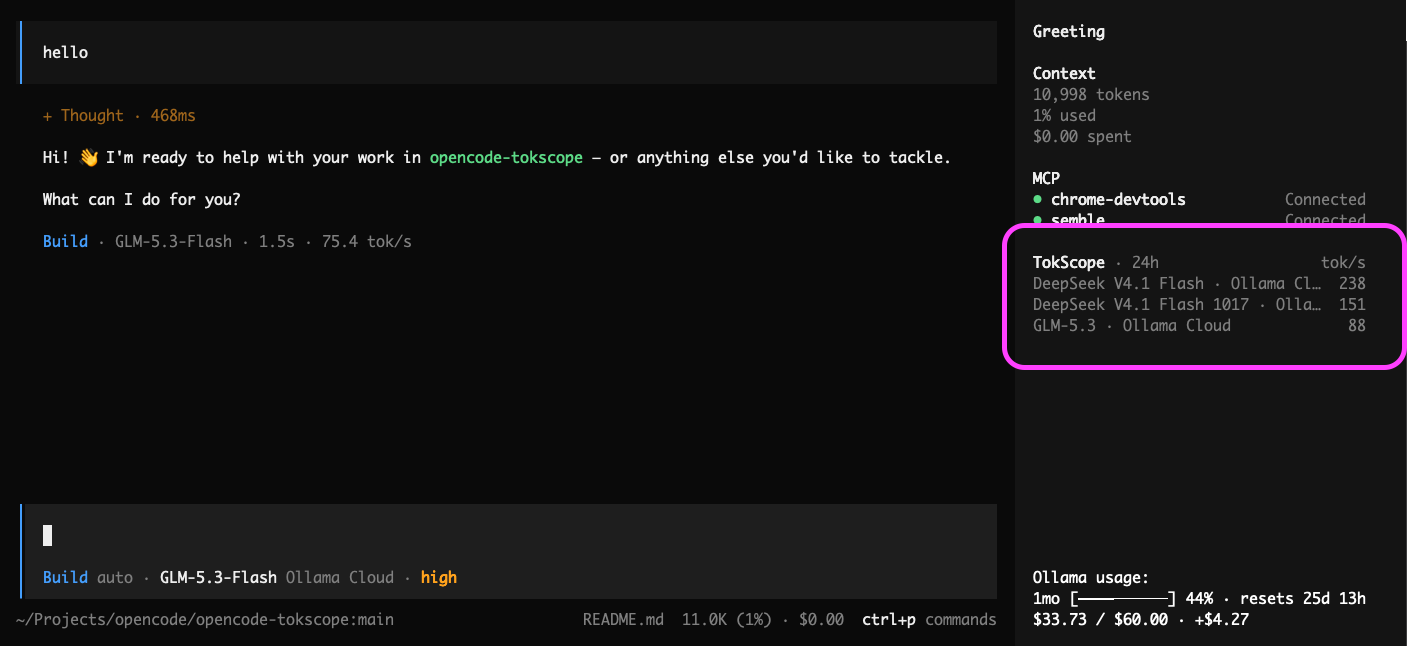
- A clickable sidebar summary of the fastest pairs so far today (local calendar day).
Install
Requires OpenCode V2 TUI.
opencode plugin add opencode-tokscopeUse
Run /tokscope, or press Ctrl+P and select Tokscope.
The page opens with all projects · last 30 days · all reasoning settings. Active filters and measured/unavailable coverage remain visible.
| Key | Action |
| --- | --- |
| ↑ / ↓ or k / j | Select a model/provider pair |
| ← / → | Select a day in its trend |
| s | Choose current project or all projects |
| t | Choose last 7 / 30 / 90 days or all history |
| r | Choose all / a recorded reasoning setting / unknown |
| Esc | Return to the previous screen |
Sidebar: shows up to three fastest pairs across all projects on the connected instance, each requiring at least three measured calls since local midnight today. Click anywhere in the widget to open the page. It refreshes after a model step completes and once a minute while visible. Read failures retain the last successful rows; no qualifying pairs shows No models with 3+ calls today.
What tok/s means
One sample is one completed model request (assistant step), including main-agent, subagent, and background activity:
tok/s = (tokens.output + tokens.reasoning) / ((time.streamed - time.created) / 1000)- Comparisons use the median of individual request rates, not an average or total tokens divided by total duration.
- The interval ends when the provider response body ends, excluding tool settlement time. Input and cache tokens do not count.
- Measurements require completion without error, a recorded stream end, positive duration, and positive generated tokens. Failed, cancelled, and in-progress requests are excluded.
- Completed requests without usable data count as unavailable, never zero throughput. Pairs with only unavailable data appear after measured rows with
0measured calls. - Existing history is read through the connected OpenCode server, including requests made before installation when the recorded data supports measurement. Daily trends use the local calendar day of completion; missing days are gaps, not zeros.