
orchgraph
v0.2.4
Published
Terminal, SVG, and HTML renderers for live agent orchestration graphs.

Maintainers
 maestrojeong
Readme
Orchgraph

See who's working on what — a small renderer toolkit for visualizing live
agent and subagent orchestration in terminals, SVG, or HTML. Point it at a
graph of who owns whom, who's delegating, who's talking to whom, and who's
still running, and Orchgraph lays it out with ELK before rendering the same
geometry in the format your host needs. (The GIF above is
scripts/demo-live.mjs animating examples/subagent-fleet.json one
delegation at a time.)
Structure vs. live state
Orchgraph can reuse one layout while runtime state changes. nodeStates
updates status markers and borders, while activeEdgeIds highlights the
execution path currently carrying work. No ELK relayout is required.
| Structure only | Live execution state |
| --- | --- |
|  |
|  |
|
The cyan path is active, green check marks are completed nodes, the yellow
filled marker is running, and the blue dotted marker is queued. Generate both
SVGs and the interactive HTML comparison with bun run demo:live-state.
Install
npm install orchgraphRequires Node.js 20+.
Build a graph
import { layoutTerminalGraph, renderTerminalCanvas } from "orchgraph";

const canvas = await layoutTerminalGraph({
  title: "Review graph",
  nodes: [
    { id: "lead", label: "Review lead", state: "running" },
    { id: "worker", label: "Worker", detail: "codex" },
  ],
  edges: [
    {
      source: "lead",
      target: "worker",
      kind: "delegation",
      label: "delegates",
      direction: "both",
    },
  ],
});

if (canvas.title) console.log(canvas.title, "\n");
console.log(renderTerminalCanvas(canvas, { color: process.stdout.isTTY }).join("\n"));
Document reference
| GraphDocument | Type | Notes |
| --- | --- | --- |
| nodes, edges | GraphNode[], GraphEdge[] | required |
| id, title | string | optional; title is exposed as canvas.title, not baked into canvas.lines |
| direction | "DOWN" \| "UP" \| "LEFT" \| "RIGHT" | default "DOWN"; overridden by LayoutOptions.direction |
| metadata | Record<string, unknown> | passed through, ignored by layout/render |
| GraphNode | Type | Notes |
| --- | --- | --- |
| id, label | string | required |
| detail, kind | string | optional; detail renders under the label, kind is a fallback if detail is absent |
| state | NodeState | "idle" \| "queued" \| "running" \| "blocked" \| "succeeded" \| "failed", default "idle" (no color by default — see Render live state) |
| metadata | Record<string, unknown> | passed through |
| GraphEdge | Type | Notes |
| --- | --- | --- |
| source, target | string | required, must match node ids |
| id, label, kind | string | optional; anonymous IDs are scoped by kind, endpoints, and parallel-edge occurrence; use an explicit id when retaining live selection/animation state |
| direction | EdgeDirection | "forward" \| "backward" \| "both" \| "none", default "forward" |
| style | EdgeStyle | "solid" \| "dashed", default "solid" |
| metadata | Record<string, unknown> | passed through |
Validate untrusted input
layoutTerminalGraph validates internally, but hosts accepting graphs from
elsewhere (a file, an API request) can validate up front with the same Zod
schema:
import { parseGraphDocument } from "orchgraph";

parseGraphDocument(untrustedJson); // throws ZodError-based messages like
// "duplicate node id: worker" or "unknown target node: missing"
The underlying graphDocumentSchema (a Zod schema) is also exported, for
hosts that want .safeParse() instead of a throwing call.
Layout options
const controller = new AbortController();

const pendingCanvas = layoutTerminalGraph(graphDocument, {
  direction: "RIGHT", // overrides GraphDocument.direction
  spacing: 6, // clamped to 2..20, default 4
  signal: controller.signal,
  timeoutMs: 15_000, // must be a positive finite number
});

controller.abort();
await pendingCanvas; // rejects with AbortError
Reuse geometry or provide a layout engine
The convenience API above performs validation, layout, and terminal rendering. Renderers and live hosts can split those stages and reuse the geometry:
import { layoutGraph, renderTerminalGraph } from "orchgraph";

const geometry = await layoutGraph(graphDocument);
const canvas = renderTerminalGraph(graphDocument, geometry);
GraphGeometry contains only positioned node bounds and routed edge points;
it has no terminal glyphs or ANSI styling. A host can therefore feed it into
another renderer. layoutGraph and layoutTerminalGraph also accept
{ engine: LayoutEngine } for applications that provide a layout backend
other than the built-in ElkLayoutEngine.
SVG and HTML renderers
The same geometry can be rendered without rerunning ELK:
import { layoutGraph } from "orchgraph";
import { renderHtmlGraph } from "orchgraph/html";
import { renderSvgGraph } from "orchgraph/svg";

const geometry = await layoutGraph(graphDocument);

const svg = renderSvgGraph(graphDocument, geometry, {
  nodeStates: currentNodeStates,
  activeEdgeIds: currentActiveEdgeIds,
});
const html = renderHtmlGraph(graphDocument, geometry, {
  nodeStates: currentNodeStates,
  activeEdgeIds: currentActiveEdgeIds,
  className: "review-panel",
});
Save a standalone SVG
The SVG result already includes its namespace, view box, accessibility title, arrow markers, and default styles, so it can be written directly to a file:
import { writeFile } from "node:fs/promises";
import { layoutGraph } from "orchgraph";
import { renderSvgGraph } from "orchgraph/svg";

const geometry = await layoutGraph(graphDocument);
const svg = renderSvgGraph(graphDocument, geometry, {
  title: "Live review team",
  pixelScale: 10,
  nodeStates: {
    lead: "running",
    reviewer: "succeeded",
  },
});

await writeFile("review-team.svg", svg, "utf8");
Build an HTML page
The HTML result is a fragment: HTML nodes sit over an SVG edge layer. Embed it in an existing application, or wrap it in a document for a quick standalone page:
import { writeFile } from "node:fs/promises";
import { layoutGraph } from "orchgraph";
import { renderHtmlGraph } from "orchgraph/html";

const geometry = await layoutGraph(graphDocument);
const graphHtml = renderHtmlGraph(graphDocument, geometry, {
  className: "review-panel",
  cellWidth: 9,
  cellHeight: 18,
  nodeStates: {
    lead: "running",
    reviewer: "succeeded",
  },
});

const page = `<!doctype html>
<html lang="en">
  <head>
    <meta charset="utf-8">
    <meta name="viewport" content="width=device-width, initial-scale=1">
    <title>Live review team</title>
  </head>
  <body>${graphHtml}</body>
</html>`;

await writeFile("review-team.html", page, "utf8");
renderSvgGraph returns a standalone SVG string. renderHtmlGraph returns an
embeddable HTML fragment with an SVG edge layer and semantic HTML node
elements. Both expose state/kind classes and data-* attributes, preserve
metadata, escape graph-provided content, and support includeStyles: false
when a host supplies its own stylesheet.
Render live state
layoutTerminalGraph returns a clean, ANSI-free canvas. Apply terminal color
and animation only when writing a frame. nodeStates overlays fresh runtime
state without mutating the canvas or rerunning ELK:
import { renderTerminalCanvas } from "orchgraph";
let animationFrame = 0;
setInterval(() => {
const lines = renderTerminalCanvas(canvas, {
color: true,
animationFrame: animationFrame++,
nodeStates: currentNodeStates,
});
process.stdout.write(`[H${lines.join("\n")}`);
}, 120);Running nodes animate through runningFrames in bold yellow by default;
queued, blocked, succeeded, and failed nodes have their own default colors
(see the exported defaultTerminalTheme), and idle has none. Hosts can
replace any state's decorator, or the running frames, and style() builds
a decorator from named options instead of raw ANSI codes:
import { defaultTerminalTheme, renderTerminalCanvas, style } from "orchgraph";

const lines = renderTerminalCanvas(canvas, {
  color: true,
  animationFrame,
  runningFrames: ["⠋", "⠙", "⠹", "⠸"],
  theme: {
    ...defaultTerminalTheme, // keep the rest, override just what you need
    running: style({ color: "orange", bold: true }),
    blocked: style({ invert: true }),
  },
});
style() accepts color (black, red, green, yellow, blue,
magenta, cyan, white, gray, orange, pink) plus bold, dim, and
invert. A decorator is just (value: string, node: TerminalNode) => string,
so a theme entry can also be a plain function — reading node.state,
node.metadata, or bounds — if you'd rather hook into an existing TUI's own
span or theme system instead of ANSI.
Edges can be color-coded the same way, keyed by an edge's free-form kind
(e.g. delegation, verification, feedback) instead of node state. The
decorator's second argument is the full TerminalEdge (id, source,
target, kind, cells), so it can also single out one specific edge by id:
const activeEdgeId = "delegation:lead:worker"; // whatever your host is tracking

const lines = renderTerminalCanvas(canvas, {
  color: true,
  edgeTheme: {
    delegation: (segment, edge) =>
      edge.id === activeEdgeId ? style({ color: "cyan", bold: true })(segment) : segment,
  },
});
There is no built-in default palette for edgeTheme since kind values are
project-specific — supply a decorator only for the kinds you want to
distinguish.
For transient execution flow, pass explicit edge IDs through activeEdgeIds.
Active edges render cyan and bold in color terminals and receive an
is-active class plus data-active="true" in SVG and HTML. Like nodeStates,
this overlay reuses existing geometry:
renderTerminalCanvas(canvas, {
  color: true,
  activeEdgeIds: new Set(["delegation:lead:worker:0"]),
});
Embed in a TUI
Orchgraph does not own stdin, stdout, or the alternate screen. clampViewport
keeps a pan position inside the canvas bounds, and terminalViewportLines
slices out just the visible rows/columns:
import { clampViewport, terminalViewportLines } from "orchgraph/terminal";

const viewport = clampViewport(canvas, { x: panX, y: panY, width: 80, height: 24 });
const lines = terminalViewportLines(canvas, viewport);
Canvas metadata (canvas.nodes[].x/y/width/height, canvas.edges[].cells)
exposes node bounds and edge cells for hit testing, panning, selection, and
live edge highlighting.
Terminal utilities
displayWidth, runeWidth, and stripAnsi are exported for hosts doing
their own column math — e.g. measuring a label before laying out a
surrounding panel, or comparing rendered output in tests without stripping
ANSI by hand:
import { displayWidth, stripAnsi } from "orchgraph";

displayWidth("한글"); // 4 — wide characters count as 2 columns
stripAnsi(decoratedLine); // the same line with ANSI escapes removed
CLI
Usage: orchgraph [file.json] [--direction DOWN|UP|LEFT|RIGHT] [--spacing 2..20] [--color]Reads a graph document from file.json, or from stdin if no file is given,
and prints the rendered canvas (with canvas.title first, if set). Flags:
-d/--direction, -s/--spacing, -c/--color (defaults to on when
stdout is a TTY), -h/--help.
npx orchgraph graph.json
cat graph.json | npx orchgraph --direction RIGHT --spacing 6 --color
Examples
Live subagent tree
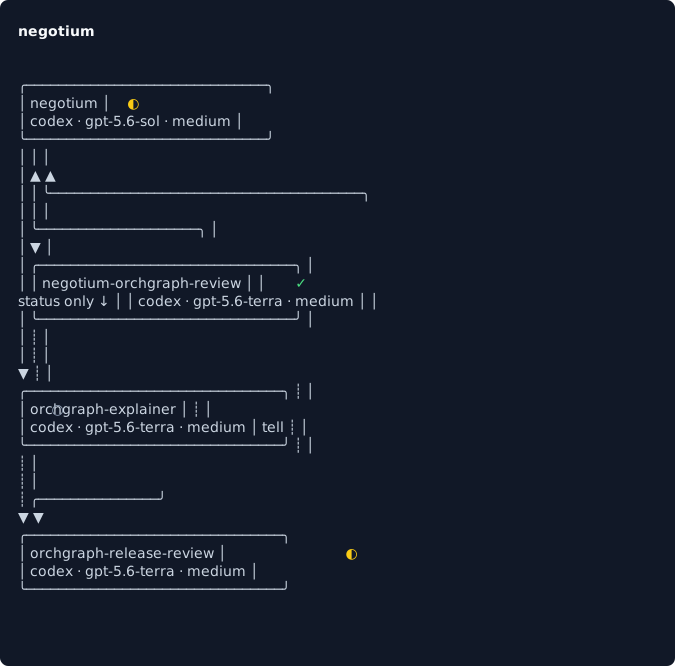
A real orchestration host (Negotium) projecting its topic tree — ownership,
a status-only child, and cross-topic messaging between siblings — into a
GraphDocument. See Runtime boundary for how a host
does that projection.
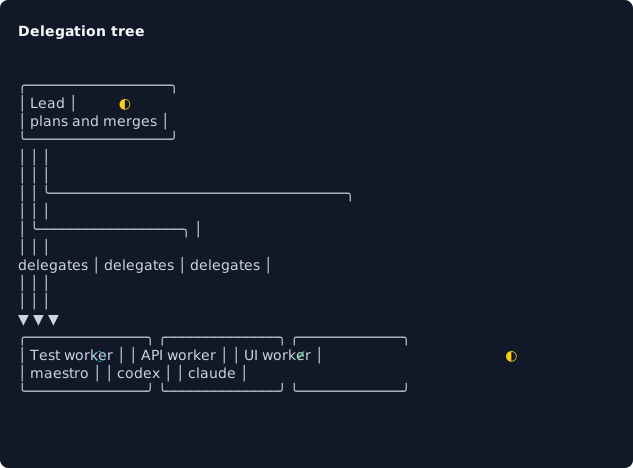
Delegation tree
One coordinator fans work out to independent agents.
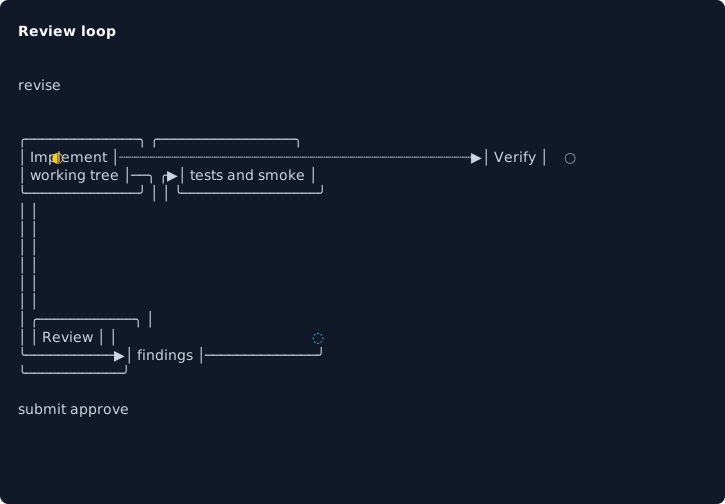
Review loop
Implementation, review, and verification form an explicit feedback loop.
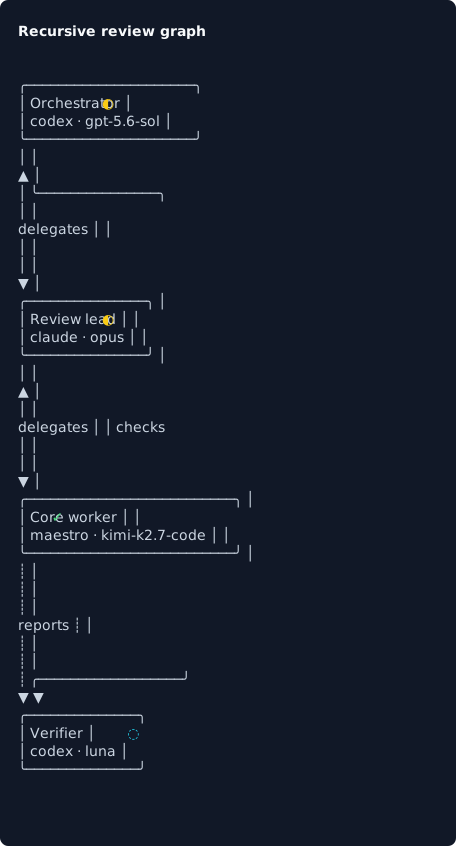
Recursive team
A depth-two team combines ownership, delegation, and cross-team messaging.
Run all source examples locally:
bun run examples
npx orchgraph examples/depth-two.json --color
Runtime boundary
Orchgraph is an npm library, not a runtime adapter — it owns graph
validation, layout, and rendering, and nothing else. A host application
projects its own domain objects into a GraphDocument:
runtime domain objects -> projection function -> GraphDocument -> OrchgraphFor Negotium, a local subagent-graph-projection.ts maps topics
(subagentReportMode, subagentTellTargetIds, delegation) into generic
nodes and edges. Orchgraph does not import Negotium or communicate with its
nodes — it only ever sees the GraphDocument that comes out of that mapping.
See Architecture and Changelog.
License
MIT