
page-timing
v3.1.5
Published
⏱ Collect and measure browser performance metrics


Readme
page-timing 


⏱ Collect and measure browser performance metrics
All metrics are converted to snake_case
import { navigation, paint } from 'page-timing';

(async () => {
    const results = await Promise.all([
        paint(),
        navigation()
    ]);

    const metrics = Object.assign(...results);

    fetch('/browser-performance-metrics', {
        method: 'POST',
        body: JSON.stringify({
            page_name: 'my page',
            metrics
        }),
    });
})();
API endpoints
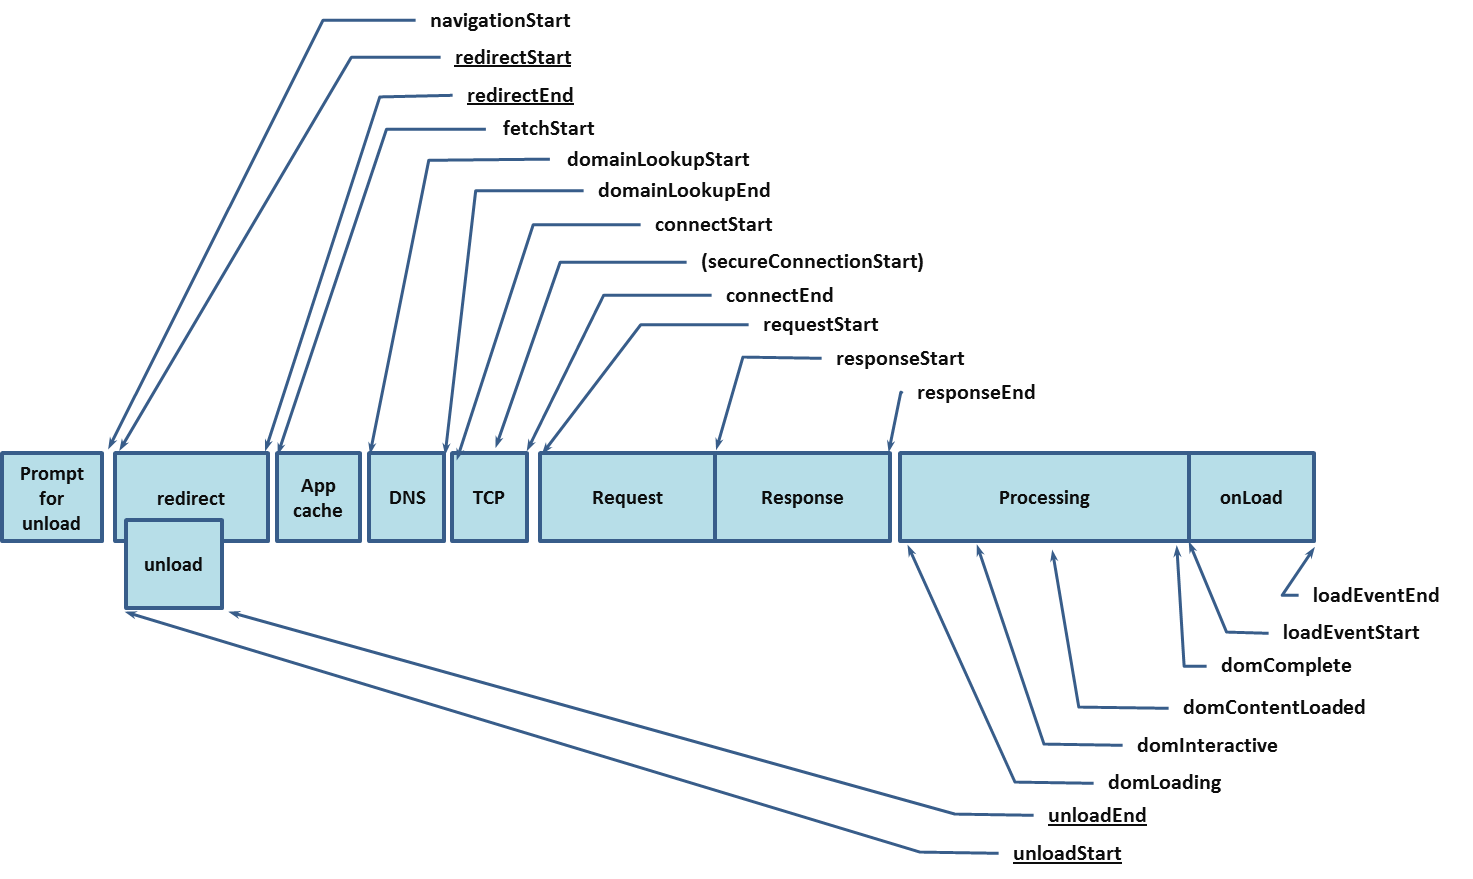
- navigation: Navigation Timing Illustration 🎨
- paint: Paint Timing
- assets: Information about page resources when this function is called
- connection: Network Information
- memory: Memory API information
- display: Screen and document information
- dom: Calculated metrics from the document object
- elapsed: Time when the measurements were taken
- all: A compound object containing all of the above
- measure: A helper function: Add measure entries to navigation timing API
Metrics
| Name | Meaning | Group | Type | - | - | - | - | navigation_start | Termination of previous document upon navigating | navigation | number | unload_event_start | Previous document unload | navigation | number | unload_event_end | | navigation | number | redirect_count | Numbers of redirects while requesting this page | navigation | number | redirect_start | Redirect from previous document | navigation | number | redirect_end | | navigation | number | fetch_start | Ready to fetch the document | navigation | number | domain_lookup_start | | navigation | number | domain_lookup_end | | navigation | number | duration | Difference between responseEnd and startTime | navigation | number | connect_start | Sent request to open a connection | navigation | number | connect_end | | navigation | number | secure_connection_start | Secure connection handshake | navigation | number | request_start | Request the document | navigation | number | response_start | Received the first byte of the response | navigation | number | response_end | Received the last byte of the response | navigation | number | dom_loading | Parser started work | navigation | number | dom_interactive | Parser finished work on main document. Changed document readyState to "interactive" | navigation | number | dom_content_loaded_event_start | Executed required scripts after parsing the document | navigation | number | dom_content_loaded_event_end | | navigation | number | dom_complete | Changed document readyState to "complete" | navigation | number | load_event_start | All assets are loaded. Document fires "load" event | navigation | number | load_event_end | Document finished executing "load" event listeners | navigation | number | transfer_size | Size (octets) of response headers and payload body | navigation | number | encoded_body_size | Size (octets) of payload body | navigation | number | decoded_body_size | Size (octets) of message body | navigation | number | worker_start | Time until service worker ran | navigation | number | first_paint | User agent first rendered after navigation | paint | number | first_contentful_paint | Document contains at least one element that is paintable and contentful † | paint | number | first_image_paint | TBD | paint | number | final_asset_javascript_count | Total number of Javascript resources | assets | number | final_asset_javascript_load | Loading time spent on Javascript resources | assets | number | final_asset_javascript_size | Total size of Javascript resources | assets | number | final_asset_stylesheets_count | Total number of CSS resources | assets | number | final_asset_stylesheets_load | Loading time spent on CSS resources | assets | number | final_asset_stylesheets_size | Total size of CSS resources | assets | number | final_asset_images_count | Total number of image resources | assets | number | final_asset_images_load | Loading time spent on image resources | assets | number | final_asset_images_size | Total size of image resources | assets | number | final_asset_other_count | Total number of other resources | assets | number | final_asset_other_load | Loading time spent on other resources | assets | number | final_asset_other_size | Total size of other resources | assets | number | connection_type | bluetooth, cellular, ethernet, none, wifi, wimax, other, unknown | connection | string | effective_bandwidth | Mbps | connection | number | effective_connection_type | slow-2g, 2g, 3g, 4g | connection | string | effective_max_bandwidth | Mbps | connection | number | reduced_data_usage | Vendor's "Data Saver" feature enables | connection | boolean | round_trip_time | Estimated effective round-trip in ms | connection | number | navigation_type | navigate, reload, back_forward, prerender | connection | string | js_heap_size_limit | Maximum bytes available for JS heap | memory | number | total_js_heap_size | Total allocated bytes for JS heap | memory | number | used_js_heap_size | Currently active bytes of JS heap | memory | number | window_inner_height | Height of the window's layout viewport | display | number | window_inner_width | Width of the window's layout viewport | display | number | screen_color_depth | Color depth of the screen | display | number | screen_pixel_depth | Bit depth of the screen | display | number | screen_orientation_type | landscape-primary, landscape-secondary, portrait-primary, portrait-secondary | display | string | final_dom_node_count | Total number of nodes under the document object | dom | number | final_dom_nest_depth | Highest nesting depth of DOM element under the document | dom | number | final_html_size | Character count of the HTML document | dom | number | page_time_elapsed | milliseconds elapsed since the time origin | elapsed | number
† contentful element: A visible element which contains non empty text, media content or input.
More functions
fps
Measure page frame rate at a certain point in time
import { fps } from 'page-timing';

const frames_per_second = await fps();
console.log({ frames_per_second });
Increase sample rate by checking more than one second. (Result is still in frames per second)
const frames_per_second = await fps({ sample: 5 });
console.log({ frames_per_second });
measure
Wrap a function and measure it's execution time in milliseconds into a performance measure entry.
import { measure } from 'page-timing';

async function myFunction(
    await wait(50);
    doSomethingElse();
}

await measure(myFunction, 'my-function');

// Example: Convert entries to a named array
Object.assign(
    ...performance.getEntriesByType('measure').map(
        ({ name, duration }) => ({[name]: duration})
    )
);
// {my-function: 53.35999990347773}

// Example: Retrieve a specific entry
const { duration } = performance.getEntriesByName('my-function');
// 53.35999990347773
Illustration of navigation events
Bonus
A simple example to add web vitals and TTI
npm i page-timing web-vitals tti-polyfillimport { all, connection } from 'page-timing';
import { getLCP, getFID, getCLS } from 'web-vitals';
import TTI from 'tti-polyfill';
(async () => {
const connectionInfo = await connection();
// Send metrics from browser performance API
send(await all());
// Send web vitals to the same endpoint
[
[getLCP, 'largest_contentful_paint'],
[getFID, 'first_input_delay'],
[getCLS, 'cumulative_layout_shift'],
].forEach(
([ fn, name ]) => fn(
({ value }) => send({
[name]: value,
...connectionInfo // Some connection info
})
)
);
TTI.getFirstConsistentlyInteractive().then(
(time_to_interactive) => send({
time_to_interactive,
...connectionInfo // Some connection info
})
).catch(() => null)
})();
const send = metrics => fetch('/browser-performance-metrics', {
method: 'POST',
body: JSON.stringify({ page_name: 'my page', metrics }),
});