
patal-log
v1.1.0
Published
A scalable, dual-module logging and tracing library for Node.js with circuit breaker and log rotation support.
Maintainers
 arbaazkhanark2327
Readme
🚀 Patal Log - Advanced Logging System for Node.js
📖 Table of Contents
- Overview
- Features
- Installation
- Quick Start
- Core Concepts
- API Reference
- Configuration
- Examples
- Advanced Features
- Troubleshooting
- Contributing
🚀 Overview
Patal Log is a comprehensive, production-ready logging library designed for modern Node.js applications.
It provides structured logging, circuit breaker protection, log rotation, and HTTP request tracking out of the box.
Built with TypeScript and supporting both CommonJS and ESM modules, it's perfect for applications of any scale.
💡 Why Patal Log?
| Feature | Description | |----------|--------------| | 🛡️ Circuit Breaker Protection | Prevents log flooding during system failures | | 📁 Smart Log Rotation | Automatic file management with size-based rotation | | 🎨 Colorful Output | Customizable colors for better readability | | 🌐 HTTP Logging | Express middleware for request/response tracking | | 🔍 Async Context | Request tracing across async operations | | 📊 Multiple Log Levels | Debug, Info, Warn, Error — all configurable |
Patal Log — Simple, Fast, and Reliable Logging for Scalable Node.js Applications ⚡
✨ Features
| Feature | Description | Benefit | |---------------------------|------------------------------------------|------------------------------------------| | Dual Module Support | Supports both CommonJS & ESM | Works with any Node.js project | | Circuit Breaker | Automatically disables logging on errors | Prevents log spam during outages | | Log Rotation | Size-based file rotation | Prevents disk space issues | | HTTP Middleware | Express.js request logging | Tracks complete request lifecycle | | Structured Logging | JSON metadata with trace IDs | Enables easy parsing and analysis | | Color Customization | Custom colors for each log level | Improves visual clarity and distinction | | TypeScript Ready | Full TypeScript definitions provided | Enhances development experience |
📦 Installation
Install Patal Log using npm:
npm install patal-log 🧩 Peer Dependencies
Make sure you have the following dependencies installed in your project:
npm install express uuid🎯 Quick Start
⚙️ CommonJS Usage
const { logger, httpLogger } = require('patal-log');
const express = require('express');

const app = express();

// Initialize logger
logger.init({
  mode: 'pro',
  logLevel: 'info',
  filePath: './logs/app.log'
});

// Use HTTP middleware
app.use(httpLogger());

app.get('/', (req, res) => {
  logger.info('Home route accessed', {
    functionName: 'HomeController/index',
    metadata: { user: 'test' }
  });
  res.send('Hello World!');
});

app.listen(3000);
⚙️ ESM Usage
import { logger, httpLogger } from 'patal-log';
import express from 'express';

const app = express();

// Initialize logger
logger.init({
  mode: 'pro',
  logLevel: 'info',
  filePath: './logs/app.log'
});

// Use HTTP middleware
app.use(httpLogger());

app.get('/', (req, res) => {
  logger.info('Home route accessed', {
    functionName: 'HomeController/index',
    metadata: { user: 'test' }
  });
  res.send('Hello World!');
});

app.listen(3000);
🧠 Core Concepts
1. 🔹 Log Levels
Patal Log supports four log levels with the following hierarchy:
DEBUG → INFO → WARN → ERROR
| Level | Description | |--------|--------------| | 🪲 DEBUG | Detailed information useful for debugging. | | ℹ️ INFO | General operational information about the system. | | ⚠️ WARN | Warning messages that don’t break functionality but need attention. | | ❌ ERROR | Error conditions that might affect normal operations. |
You can configure the minimum log level using the logLevel option in logger.init().
2. 🛡️ Circuit Breaker Pattern
The Circuit Breaker mechanism protects your application from log flooding during high failure rates or system issues.
When too many errors occur in a short period, the circuit breaker temporarily pauses log writing to prevent performance degradation or disk overload.
Once the system stabilizes, logging automatically resumes.
⚙️ This ensures your application remains performant and reliable even during unexpected spikes or failures.
🧩 Circuit Breaker Flow (Visual Representation)
You can visualize how the Circuit Breaker works in Patal Log using this flowchart:
🧩 Circuit Breaker Flow (Visual Representation)
You can visualize how the Circuit Breaker mechanism works in Patal Log using this flow diagram:
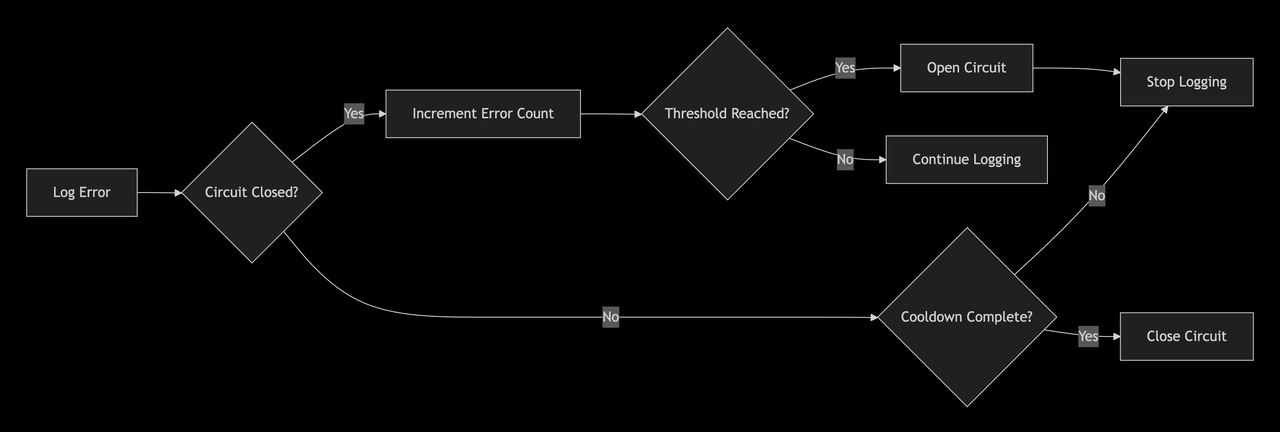
✅ Explanation:
- When an error is logged → the system checks if the circuit is closed.
- If closed → it increases the error count.
- Once errors cross a threshold, the circuit opens → logging stops temporarily.
- After a cooldown period, the circuit closes again and logging resumes.
3. 🔄 Log Rotation
Automatic file management prevents disk space issues and keeps logs organized.
When a log file exceeds the defined size, it is automatically rotated and renamed with a timestamp.
Example directory structure:
🗂️ Log Directory Structure
logs/
├── app.log                        # Current active log file
├── app-2024-01-15_10-30-45.log    # Rotated file (newer)
└── app-2024-01-15_09-15-20.log    # Rotated file (older)
4. ⚙️ Async Local Storage
Maintains request context across asynchronous operations, ensuring that each request has its own unique Trace ID — even across async or Promise-based flows.
// Trace ID is automatically maintained across async calls
async function processUser() {
  logger.info('Processing user', {
    functionName: 'UserService/processUser'
    // Trace ID is automatically included from HTTP context
  });

  await databaseCall(); // Trace ID persists
  await externalAPICall(); // Trace ID persists
}
5. 🌐 HTTP Middleware
The HTTP Logger Middleware automatically tracks incoming requests and outgoing responses in your Express app.
It captures details like method, URL, response time, and trace ID — helping you monitor performance and debugging efficiently.
import express from 'express';
import { logger, httpLogger } from 'patal-log';

const app = express();

// Initialize logger
logger.init({
  mode: 'pro',
  logLevel: 'info',
  filePath: './logs/server.log'
});

// Use the HTTP logger middleware
app.use(httpLogger());

app.get('/api/user', (req, res) => {
  logger.info('User route accessed', {
    functionName: 'UserController/getUser',
    metadata: { userId: 123 }
  });
  res.json({ message: 'User details fetched successfully' });
});

app.listen(4000, () => {
  logger.info('Server started on port 4000');
});
📊 Example Log Output
[INFO] [2025-01-15T10:30:45.231Z] [TRACE-ID: 91b3a...] [GET /api/user 200 34ms] User route accessed📚 API Reference
⚙️ Logger Configuration
LoggerConfig
Configuration options used to initialize the logger.
| Option | Type | Default | Description | Behavior (If Not Provided) |
|:-------|:------|:----------|:-------------|:----------------------------|
| mode | "dev" or "pro" | "dev" | Determines the logging mode — dev for console logs with colors, pro for production log files. | Defaults to "dev" — logs will appear only in the console, no files will be created. |
| logLevel | "debug", "info", "warn", "error" | "info" | Sets the minimum level of logs to capture. | Only info, warn, and error messages will be logged. Debug logs will be ignored. |
| filePath | string | "./logs/app.log" | Path where logs are stored in production mode. | Logs will be written to ./logs/app.log by default (auto-created if not found). |
| maxSize | number (in bytes) | 5 * 1024 * 1024 | Max file size before rotation (default 5 MB). | Log file will rotate automatically after reaching 5 MB. |
| maxFiles | number | 10 | Maximum number of rotated files to retain. | Oldest logs beyond 10 files are deleted automatically. |
| enableCircuitBreaker | boolean | true | Enables the circuit breaker to prevent excessive logging under failures. | Circuit breaker remains active and automatically handles log flooding. |
| errorThreshold | number | 5 | Number of consecutive errors allowed before opening the circuit. | After 5 consecutive log errors, new logs will be temporarily paused. |
| cooldownPeriod | number (ms) | 60000 | Cooldown duration before circuit resets. | Circuit will auto-reset after 60 seconds. |
| consoleOutput | boolean | true | Enables console output for logs. | Logs will be visible in console output even if file logging is enabled. |
LogOptions
Optional metadata for additional log context.
| Option | Type | Description | Behavior (If Not Provided) |
|:--------|:------|:-------------|:----------------------------|
| functionName | string | Function or module name generating the log. | Function name will be omitted from log metadata. |
| metadata | object | Custom contextual details (e.g., user ID, payload). | No extra metadata will be attached to the log. |
| traceId | string | Override for trace ID. Usually auto-generated. | A unique trace ID will be auto-assigned via Async Local Storage. |
🧠 Logger Methods
logger.init(config: LoggerConfig)
Initializes the logger with the given configuration.
logger.info(message: string, options?: LogOptions)
Logs an informational message.
logger.debug(message: string, options?: LogOptions)
Logs a debug message.
logger.warn(message: string, options?: LogOptions)
Logs a warning message.
logger.error(message: string, options?: LogOptions)
Logs an error message.
logger.getCircuitBreakerStatus()
Returns the current circuit breaker status (open, closed, or half-open).
logger.resetCircuitBreaker()
Resets the circuit breaker manually.
logger.getRotationStatus()
Returns current log rotation information — file size, rotation count, etc.
logger.rotateLogs()
Manually triggers a log rotation.
🌐 HTTP Middleware
httpLogger(config?: LoggerConfig)
Express middleware for automatic HTTP request logging.
Captures:
- HTTP method & URL
- Status code & response time
- Trace ID & metadata
Example:
import express from 'express';
import { httpLogger } from 'patal-log';

const app = express();
app.use(httpLogger());
⚙️ Configuration
🧩 LoggerConfig Options
| Parameter | Type | Default | Description |
|:-----------|:------|:----------|:-------------|
| mode | 'simple' | 'pro' | 'simple' | simple → Console only, pro → File + Console logging. |
| logLevel | 'debug' | 'info' | 'warn' | 'error' | 'info' | Minimum log level to output. |
| filePath | string | undefined | File path for log files (required in 'pro' mode). |
| includeIp | boolean | true | Include client IP in HTTP logs. |
| includeUserAgent | boolean | true | Include User-Agent header in HTTP logs. |
| includeParams | boolean | false | Include route parameters (req.params) in HTTP logs. |
| includeQueries | boolean | false | Include query parameters (req.query) in HTTP logs. |
| includeResponseHeaders | boolean | false | Include response headers in HTTP logs. |
| includeSendData | boolean | false | Include request body or payload in HTTP logs. |
| colors | boolean | true | Enable colorful console output. |
| customColors | object | {} | Define custom colors per log level (e.g., { info: 'cyan' }). |
| circuitBreaker | CircuitBreakerOptions | {} | Circuit breaker configuration. |
| rotation | RotationOptions | {} | Log rotation configuration. |
🧠 LogOptions Parameters
| Parameter | Type | Required | Description |
|:-----------|:------|:-----------|:-------------|
| functionName | string | ✅ | Function name for tracing (e.g., 'UserService/create'). |
| metadata | object | ❌ | Additional key-value metadata (context info, IDs, etc.). |
| error | Error | ❌ | Error object for detailed stack trace logging. |
| customColor | string | ❌ | Custom color for this specific log line. |
| logColor | string | ❌ | Applies color only to the log message. |
| fullLogColor | string | ❌ | Applies color to the entire log line except log level. |
⚡ CircuitBreakerOptions
| Parameter | Type | Default | Description |
|:-----------|:------|:----------|:-------------|
| circuitBreakerCount | number | 5 | Number of errors allowed before circuit opens. |
| circuitBreakerTime | number (ms) | 30000 | Time window (in ms) for counting errors. |
| circuitBreakerCooldown | number (ms) | 60000 | Cooldown period before retry after circuit opens. |
| circuitBreakerCallback | function | () => {} | Callback invoked when circuit opens (useful for alerts). |
🔁 RotationOptions
| Parameter | Type | Default | Description |
|:-----------|:------|:----------|:-------------|
| enabled | boolean | false | Enables automatic log rotation. |
| maxSize | string | '10m' | Maximum log file size before rotation ('10k', '10m', '1g'). |
| maxFiles | number | 5 | Number of rotated backup files to keep. |
| compress | boolean | false | (Future feature) — Enables gzip compression of rotated logs. |
💡 Notes
- If
modeis'simple', logs print only to console — no files are created. - In
'pro'mode,filePathmust be defined or defaults to./logs/app.log. - Rotation automatically appends timestamps:
📁 Log File Structure
When log rotation is enabled, Patal Log automatically creates timestamped backups of your log files to prevent size overflow.
logs/
├── app.log                     # Current active log file
├── app-2025-01-15_10-30-45.log # Rotated file (newer)
└── app-2025-01-15_09-15-20.log # Rotated file (older)
📘 Complete Example Configuration
Here’s a full example showing how to initialize Patal Log with all major configuration options enabled — including file rotation, circuit breaker, and custom colors.
import { logger } from 'patal-log';

logger.init({
  // Logging mode
  mode: 'pro', // 'simple' → console only | 'pro' → file + console

  // Minimum log level to capture
  logLevel: 'debug', // Captures all logs: debug → info → warn → error

  // File settings
  filePath: './logs/app.log', // Main log file
  colors: true, // Enable colorful console logs

  // Optional custom colors per log level
  customColors: {
    info: 'cyan',
    debug: 'magenta',
    warn: 'yellow',
    error: 'red',
  },

  // Circuit breaker configuration
  circuitBreaker: {
    circuitBreakerCount: 5, // Max 5 consecutive errors allowed
    circuitBreakerTime: 30000, // 30s window for counting failures
    circuitBreakerCooldown: 60000, // 1 min cooldown before reset
    circuitBreakerCallback: () => {
      console.warn('⚠️ Circuit breaker opened due to excessive log failures.');
    },
  },

  // Log rotation configuration
  rotation: {
    enabled: true, // Enable rotation
    maxSize: '10m', // Rotate file after 10MB
    maxFiles: 5, // Keep last 5 rotated files
    compress: false, // (future feature)
  },

  // HTTP middleware options (optional)
  includeIp: true,
  includeUserAgent: true,
  includeParams: false,
  includeQueries: true,
  includeResponseHeaders: false,
  includeSendData: false,
});
🧠 Explanation
mode→ Controls where logs go (console vs file + console).logLevel→ Filters log severity. In production,"info"or higher is recommended.filePath→ Defines the main output log file.circuitBreaker→ Prevents log flooding during repetitive system errors.rotation→ Automatically rotates and manages log files based on size.colors/customColors→ Improves readability in console output.
📂 Output Example
logs/
├── app.log
├── app-2025-01-15_10-30-45.log
└── app-2025-01-15_09-15-20.log
💡 Pro Tip
Combine this setup with the httpLogger() middleware to automatically log incoming requests with trace IDs and response times.
import express from 'express';
import { httpLogger } from 'patal-log';

const app = express();

// Attach middleware for automatic request logging
app.use(httpLogger()); // Logs all incoming HTTP requests automatically

app.get('/', (req, res) => {
  res.send('Hello, Patal log is working!');
});

app.listen(3000, () => console.log('🚀 Server running on port 3000'));
🧩 What this does
📝 Automatically logs all incoming HTTP requests.
No need to manually log each endpoint — every request is captured.⚙️ Captures detailed request information:
Includes method, route path, status code, duration, and client IP.🧵 Generates a unique Trace ID for each request.
Makes it easy to trace logs across async operations and microservices.🚀 Optimized for production performance and debugging.
Helps you monitor, audit, and diagnose API behavior in real time.
📝 Examples
🧩 Basic Logging Examples
// Simple info log
logger.info('User login successful', {
  functionName: 'AuthService/login',
  metadata: { userId: 123, provider: 'google' }
});

// Debug log with metadata
logger.debug('Processing payment', {
  functionName: 'PaymentService/process',
  metadata: { amount: 99.99, currency: 'USD' }
});

// Warning log
logger.warn('Rate limit approaching', {
  functionName: 'RateLimitService/check',
  metadata: { current: 95, limit: 100 }
});

// Error log with error object
logger.error('Database connection failed', {
  functionName: 'DatabaseService/connect',
  error: new Error('Connection timeout'),
  metadata: { host: 'db.example.com', port: 5432 }
});
🎨 Advanced Logging with Custom Colors
// Custom color for specific log
logger.info('Special event occurred', {
  functionName: 'EventService/process',
  customColor: 'brightMagenta',
  metadata: { event: 'user_upgrade' }
});

// Different message color
logger.warn('Deprecated API called', {
  functionName: 'APIService/handleRequest',
  logColor: 'brightYellow',
  metadata: { endpoint: '/v1/old', suggested: '/v2/new' }
});

// Full log color
logger.debug('Debug information', {
  functionName: 'DebugService/trace',
  fullLogColor: 'cyan',
  metadata: { debugId: 'abc123' }
});
🌐 HTTP Logging Examples
Demonstrates how to integrate the httpLogger() middleware into an Express app for automatic HTTP request/response logging.
import express from 'express';
import { httpLogger } from 'patal-log';

const app = express();

// ✅ Basic HTTP logging
app.use(httpLogger());

// ⚙️ Advanced HTTP logging with detailed options
app.use(httpLogger({
  mode: 'pro',
  logLevel: 'debug',
  includeIp: true,
  includeUserAgent: true,
  includeParams: true,
  includeQueries: true,
  includeResponseHeaders: true,
  includeSendData: true,
  filePath: './logs/http.log'
}));

app.post('/users', (req, res) => {
  // Automatically logs the request with all configured options
  const user = req.body;
  // ... process user
  res.status(201).json(user);
});
🧠 What this does
🧾 Logs detailed HTTP activity automatically:
Captures the method, URL, status code, response time, and trace ID for every request.⚙️ Captures additional context when enabled:
Includes headers, query parameters, and request body based on your configuration.🧵 Maintains async context seamlessly:
Every request has a unique Trace ID, even across asynchronous or promise-based operations.🚀 Ideal for production debugging and monitoring:
Helps developers quickly identify performance bottlenecks, failed requests, and request flow across services.
🔧 Advanced Features
⚙️ Circuit Breaker Management
// Check circuit breaker status
const status = logger.getCircuitBreakerStatus();
console.log('Circuit Breaker Status:', status);

// Manually reset circuit breaker
logger.resetCircuitBreaker();

// Example: Monitoring circuit breaker
setInterval(() => {
  const status = logger.getCircuitBreakerStatus();
  if (status.isOpen) {
    console.log(`Circuit breaker open. Cooldown remaining: ${status.remainingCooldown}ms`);
  }
}, 5000);
🔄 Log Rotation Management
// Check rotation status
const rotationStatus = logger.getRotationStatus();
console.log('Rotation Status:', rotationStatus);

// Manually trigger rotation
logger.rotateLogs();

// Example: Monitoring disk usage
setInterval(() => {
  const status = logger.getRotationStatus();
  if (status && status.sizePercentage > 80) {
    console.log(`Log file is ${status.sizePercentage.toFixed(1)}% full`);
  }
}, 60000);
🧠 What this does:
🔍 Monitors log file size in real-time
Continuously checks the active log file to ensure it doesn't exceed the configured limit.♻️ Automatically rotates the log file
When the file reaches the defined maximum size, it’s archived and a new file is created automatically.💾 Prevents disk overflow
Keeps your production environment stable by managing log storage efficiently.📈 Returns useful rotation statistics
Provides details like current file size, rotation count, and usage percentage.
⚙️ When to use:
Use this feature for long-running applications such as:
- 🖥️ Backend servers
- ⚙️ Microservices
- 🧾 Job schedulers
- 🚀 Production APIs
It ensures your log files remain lightweight, organized, and storage-friendly — preventing performance drops or crashes caused by large log files.
🪲 Debug Mode
Enable debug log level to view internal operations and insights:
logger.init({
  logLevel: 'debug',
  mode: 'simple' // Use simple mode to see debug logs in console
});
🪲 Debug Mode
Enable debug log level to trace internal operations, performance, and request flow — ideal for local development and testing.
logger.init({
  logLevel: 'debug',
  mode: 'simple' // Use simple mode to see debug logs in console
});
🧠 Debug Mode
This mode helps you trace internal behavior, performance metrics, and execution flow across async calls — ideal for debugging and local testing.
📊 Performance Considerations
✅ Best Practices
⚙️ Use Appropriate Log Levels:
Avoid usingdebugin production environments — it can increase log volume and affect performance.🧱 Structured Metadata:
Keep metadata objects lean and structured for faster serialization and reduced overhead.🧯 Circuit Breaker:
Always enable it in production to prevent log flooding during recurring or repetitive errors.🔁 Log Rotation:
Essential for long-running applications to prevent oversized log files and disk bloat.🧵 Async Operations:
The logger fully supports asynchronous execution with context preservation, ensuring trace continuity across async calls.
💾 Memory Usage
The logger is designed for maximum efficiency and minimal memory overhead:
- 🧩 Metadata is serialized immediately after being logged.
- 🪶 File writes use stream-based output (no full-buffer storage).
- 🧯 Circuit breaker actively prevents memory leaks during outages.
This makes it perfectly suited for large-scale Node.js production systems.
🔍 Patal-Log - Advanced Node.js Logger

![]()
A powerful and production-ready logging library for Node.js with traceId propagation, circuit breaker, log rotation, HTTP & Prisma integration, and async context support.
🚀 Features
- ✅ TraceId propagation using AsyncLocalStorage
- ✅ HTTP request logging middleware
- ✅ External API call logging
- ✅ Prisma SQL query logging with traceId
- ✅ Circuit breaker for log overload protection
- ✅ Log rotation support
- ✅ File & console logging
- ✅ Background job trace support
📦 Installation
npm install patal-log
# or
yarn add patal-log
⚡ Quick Start
Basic Logger Setup
import { logger } from 'patal-log';

logger.init({
  mode: 'pro',
  logLevel: 'info',
  filePath: './logs/app.log',
  colors: true,
});

logger.info('User logged in', {
  functionName: 'AuthController.login',
  metadata: { userId: '123' }
});
🌐 HTTP Request Logging
import express from 'express';
import { httpLogger } from 'patal-log';

const app = express();
app.use(httpLogger());

app.get('/api/users', (req, res) => {
  res.json({ users: [] });
});
Each request automatically gets a traceId.
🧭 TraceId Utilities (v1.1.0)
getLiveTraceId()
import { getLiveTraceId } from 'patal-log';

const traceId = getLiveTraceId();
withTraceId()
import { withTraceId } from 'patal-log';

await withTraceId('custom-trace-id', async () => {
  logger.info('Inside trace context');
});
🔗 External API Logging
import { logExternalCall } from 'patal-log';

logExternalCall('/api/users', 'GET', {
  functionName: 'UserService.fetchUsers'
}, 200);
Custom TraceId
logExternalCall('/api/users', 'GET', {
  functionName: 'UserService.fetchUsers'
}, 200, undefined, {
  traceId: 'custom-trace-123',
  includeTraceId: true
});
Hide TraceId
logExternalCall('/analytics', 'POST', {
  functionName: 'Analytics.track'
}, 200, undefined, {
  includeTraceId: false
});
🗄️ Prisma Logging with TraceId
import { PrismaClient } from '@prisma/client';
import { getLiveTraceId } from 'patal-log';

const prisma = new PrismaClient({
  log: [{ level: 'query', emit: 'event' }],
});

prisma.$on('query', (e) => {
  const traceId = getLiveTraceId();
  console.log('[SQL]', e.query);
  if (traceId) console.log('TraceId:', traceId);
});
🧵 Background Jobs
import { withTraceId, logger } from 'patal-log';

async function processJob(job: any) {
  return withTraceId(`job-${job.id}`, async () => {
    logger.info('Job started');
    logger.info('Job completed');
  });
}
⚙️ Configuration Options
logger.init({
  mode: 'pro',
  logLevel: 'debug',
  colors: true,
  circuitBreaker: {
    circuitBreakerCount: 5,
    circuitBreakerTime: 30000,
    circuitBreakerCooldown: 60000
  },
  rotation: {
    enabled: true,
    maxSize: '10m',
    maxFiles: 5
  }
});
📘 API Reference
Logger
- logger.init(config)
- logger.info(message, options)
- logger.warn(message, options)
- logger.error(message, options)
- logger.debug(message, options)
Trace
- getLiveTraceId()
- withTraceId(traceId, callback)
HTTP
- httpLogger()
External Calls
- logExternalCall(endpoint, method, metadata, statusCode?, error?, options?)
🐛 Troubleshooting
TraceId missing in Prisma
Use withTraceId() around DB calls.
Duplicate Prisma Logs
Disable Prisma default logs:
new PrismaClient({ log: [] });Error stack too long
Now only error message is shown (v1.1.0).
📝 Changelog
v1.1.0
- Added getLiveTraceId
- Added withTraceId
- Improved async context handling
- Enhanced Prisma logging
- Trace control in external calls
v1.0.0
- Initial release
- HTTP logging
- Circuit breaker
- Log rotation
🤝 Contributing
- Fork the repo
- Create a branch (
git checkout -b feature/new-feature) - Commit changes
- Push & open PR
📄 License
MIT © Patal-Log
🤝 Contributing
We welcome all community contributions!
Please review our Contributing Guidelines before submitting a pull request.
🧑💻 Development Setup
# Clone repository
git clone https://github.com/Arbazkhanark/patal-log

# Install dependencies
npm install

# Build the project
npm run build

# Run tests
npm test
📄 License
This project is licensed under the MIT License.
See the LICENSE file for complete details.
🆘 Support
- 📚 Documentation — Explore the full usage guide and complete API reference.
- 🐛 Issue Tracker — Found a bug or have a feature request? Open an issue.
- 💬 Discussions — Join our developer community to share feedback and ideas.
Patal Log — Built with ❤️ for the Node.js community.
Empowering developers with reliable, production-grade logging and tracing.