
pbchart
v1.0.16
Published
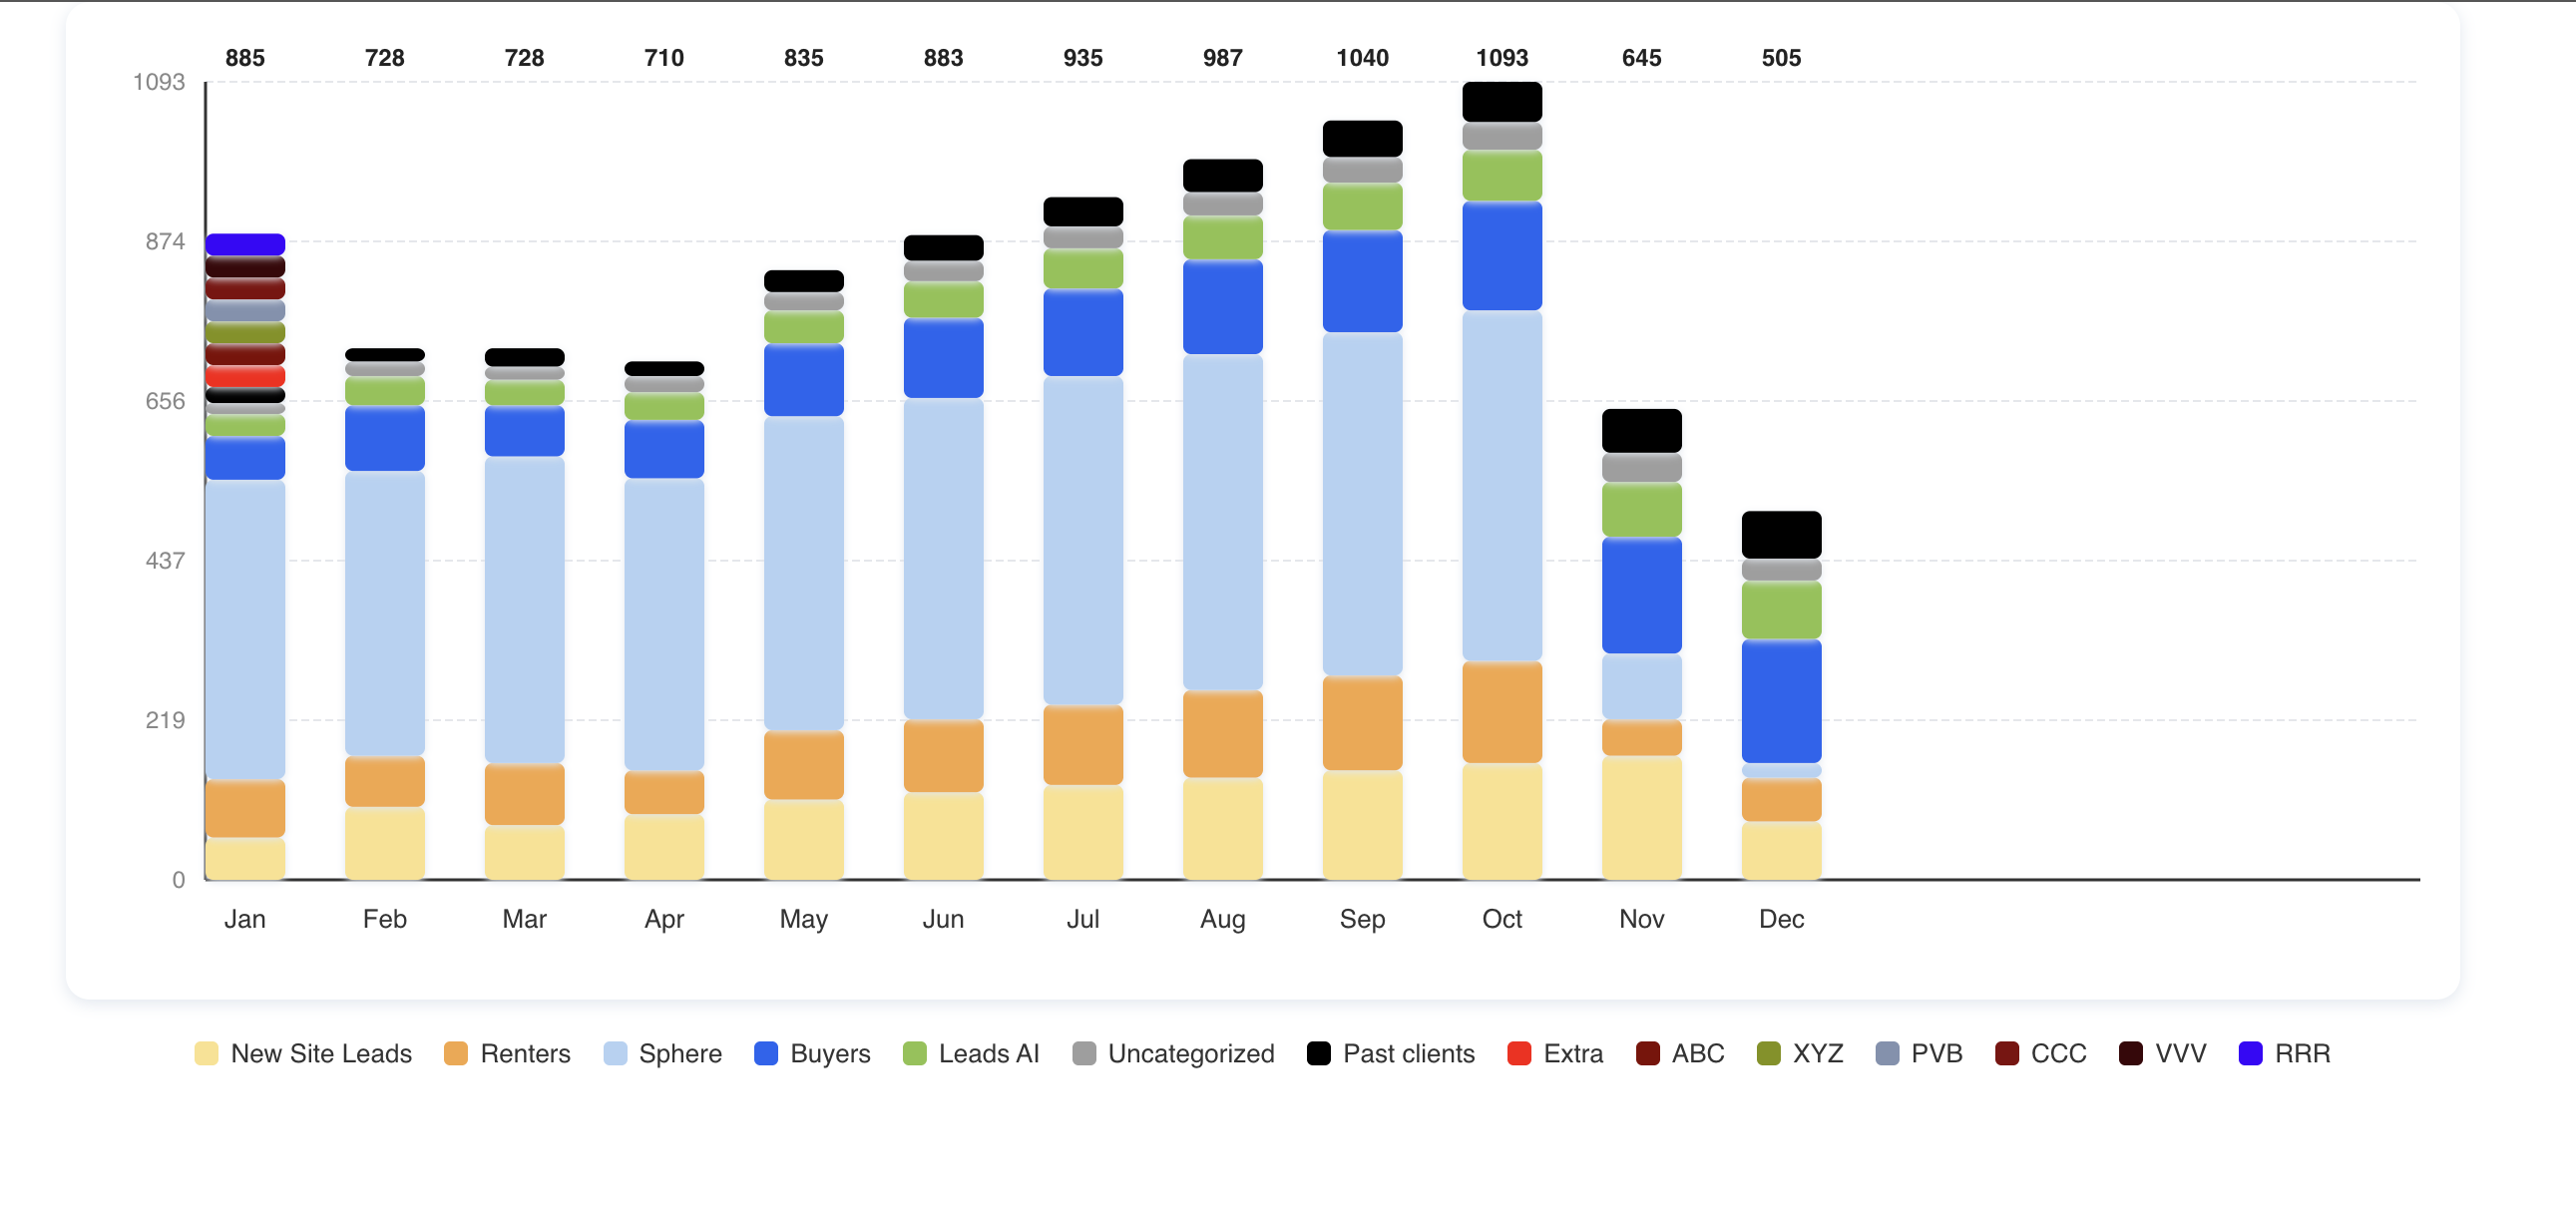
Custom Stacked Column Chart built with React and SVG
Maintainers
 pradiptabhuin
Readme
pbchart
A lightweight, customizable stacked column chart component built with React and SVG.
Features
- 📊 Beautiful, interactive stacked column chart
- 🎨 Customizable colors, size, and labels
- ⚡️ Lightweight and dependency-free (except React)
- 🖱️ Optional click and hover events for bars
- 🧩 Easy integration into any React project
Installation
npm install pbchartUsage
import BPChart from 'pbchart';

const chartData = [
    {
      month: "Jan",
      values: [
        { label: "New Site Leads", value: 58, color: "#fbe18c" },
        { label: "Renters", value: 80, color: "#f6a643" },
        { label: "Sphere", value: 410, color: "#b2d2f3" },
        { label: "Buyers", value: 60, color: "#1c64f2" },
        { label: "Leads AI", value: 30, color: "#8bc34a" },
        { label: "Uncategorized", value: 15, color: "#9e9e9e" },
        { label: "Past clients", value: 22, color: "#000000" },
      ],
    },
    {
      month: "Feb",
      values: [
        { label: "New Site Leads", value: 100, color: "#fbe18c" },
        { label: "Renters", value: 70, color: "#f6a643" },
        { label: "Sphere", value: 390, color: "#b2d2f3" },
        { label: "Buyers", value: 90, color: "#1c64f2" },
        { label: "Leads AI", value: 40, color: "#8bc34a" },
        { label: "Uncategorized", value: 20, color: "#9e9e9e" },
        { label: "Past clients", value: 18, color: "#000000" },
      ],
    },
    {
      month: "Mar",
      values: [
        { label: "New Site Leads", value: 75, color: "#fbe18c" },
        { label: "Renters", value: 85, color: "#f6a643" },
        { label: "Sphere", value: 420, color: "#b2d2f3" },
        { label: "Buyers", value: 70, color: "#1c64f2" },
        { label: "Leads AI", value: 35, color: "#8bc34a" },
        { label: "Uncategorized", value: 18, color: "#9e9e9e" },
        { label: "Past clients", value: 25, color: "#000000" },
      ],
    },
    {
      month: "Apr",
      values: [
        { label: "New Site Leads", value: 90, color: "#fbe18c" },
        { label: "Renters", value: 60, color: "#f6a643" },
        { label: "Sphere", value: 400, color: "#b2d2f3" },
        { label: "Buyers", value: 80, color: "#1c64f2" },
        { label: "Leads AI", value: 38, color: "#8bc34a" },
        { label: "Uncategorized", value: 22, color: "#9e9e9e" },
        { label: "Past clients", value: 20, color: "#000000" },
      ],
    },
    {
      month: "May",
      values: [
        { label: "New Site Leads", value: 110, color: "#fbe18c" },
        { label: "Renters", value: 95, color: "#f6a643" },
        { label: "Sphere", value: 430, color: "#b2d2f3" },
        { label: "Buyers", value: 100, color: "#1c64f2" },
        { label: "Leads AI", value: 45, color: "#8bc34a" },
        { label: "Uncategorized", value: 25, color: "#9e9e9e" },
        { label: "Past clients", value: 30, color: "#000000" },
      ],
    }
    .....rest datasate
]

    <BPChart
        data={chartData}
        height={500}
        width={1200}
        onBarClick={({ label, value, month }) => {
          console.log(`${label} clicked: ${value} in ${month}`);
          // trigger modal, link, or drill-down here
        }}
    />
Props
| Prop | Type | Description | |--------------|----------|--------------------------------------------------| | data | array | Chart data (see example above) | | height | number | Chart height (optional, default: 400) | | width | number | Chart width (optional, default: 800) | | maxValue | number | Maximum Y value (optional, auto-calculated) | | onBarClick | function | Callback when a bar is clicked (optional) |
License
MIT