
perf-lens
v2.0.2
Published
AI-powered frontend performance optimizer

Maintainers
 moiz.imran
Readme
PerfLens 🔍
Lighthouse finds the slow pages. PerfLens finds the slow code.




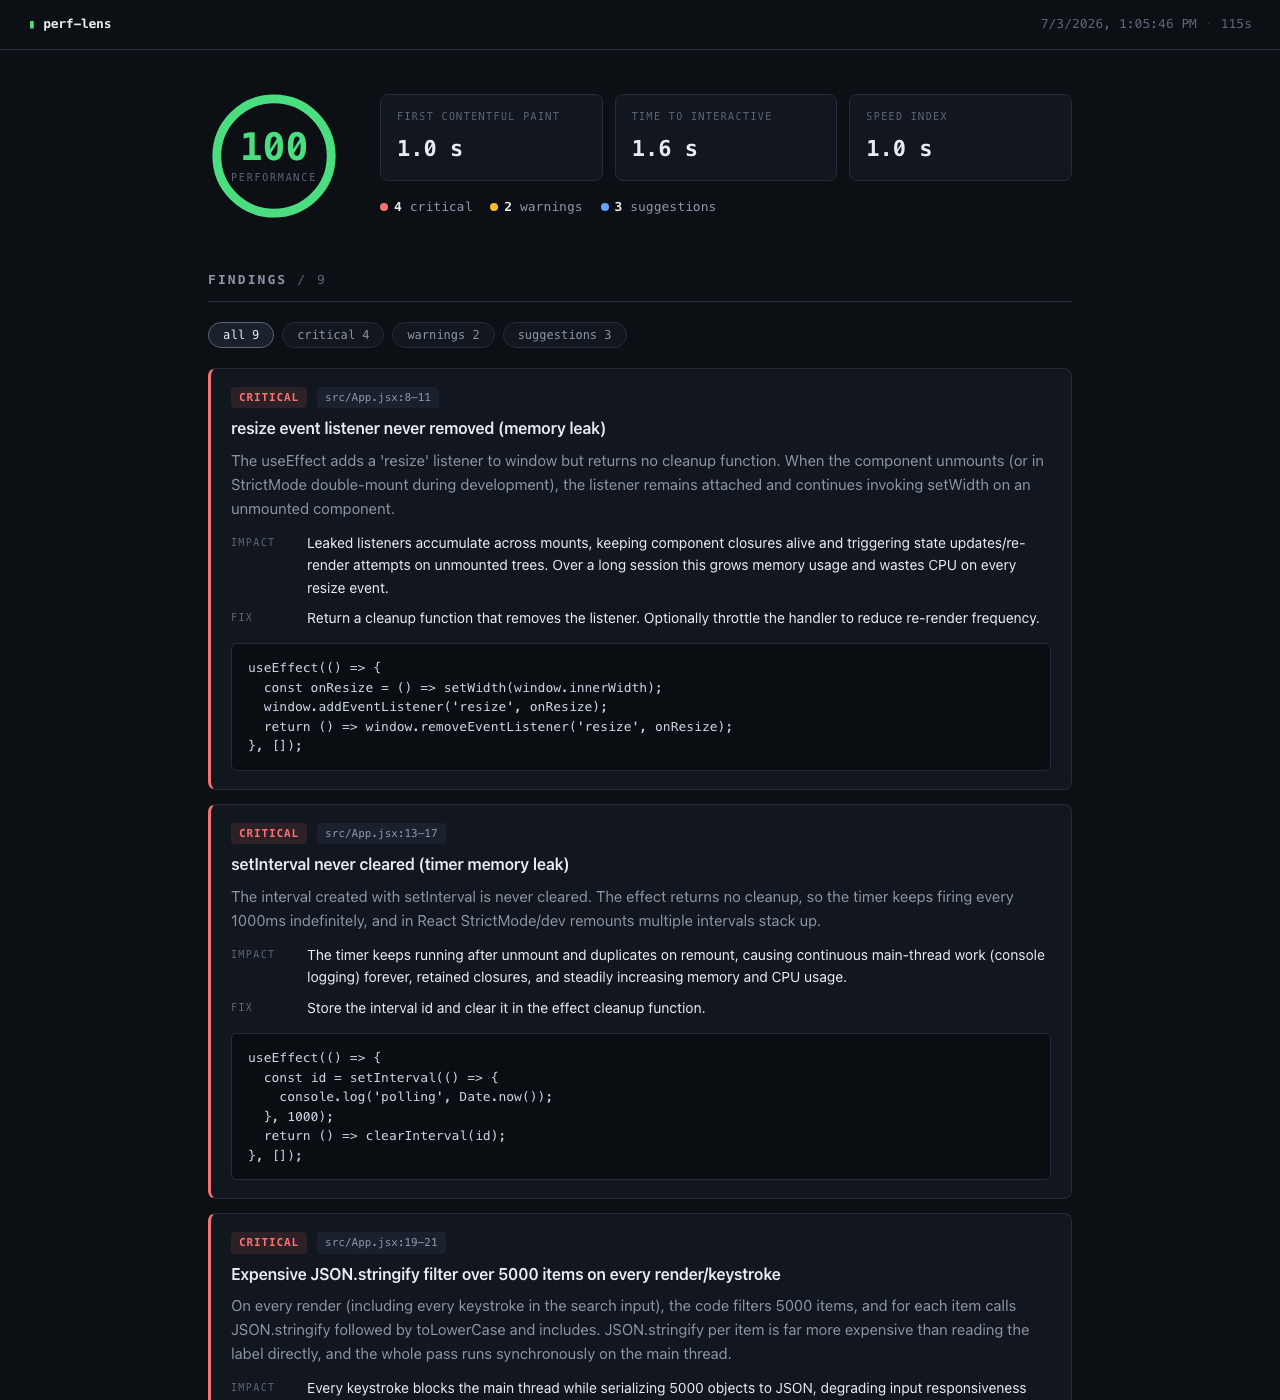
PerfLens runs Lighthouse against your dev server, then puts Claude to work on your source code with those results as evidence. The report reads like a code review: "this useEffect in ProductGrid.tsx:47 refetches on every render," with severity, impact, and corrected code for each finding. Every file/line location is checked against the actual file before it reaches the report, and --fail-on critical turns the scan into a CI gate.
How it works
Two analysis modes share the same finding schema and report pipeline:
Scan mode (default) — files are prioritized, batched, and sent to Claude with the Lighthouse context. Findings come back through structured outputs (a zod schema enforced by the API), so results are typed and validated rather than scraped out of prose. Every reported file/line location is verified against the actual file before it reaches the report.
Agent mode (--agent) — instead of being handed files, the model investigates the codebase itself through a hand-rolled tool-use loop (list_files, read_file, grep), forms hypotheses from the Lighthouse data, reads the relevant code, and submits findings via a final report_findings tool call. Tool access is sandboxed to the target directory.
Under the hood:
- Structured outputs via
messages.parse()+ zod — schema-guaranteed JSON findings - Agentic tool use — multi-turn investigation loop with strict tool schemas and a forced final report
- Prompt caching — the stable system prefix (expert prompt + Lighthouse context) is cached across batch calls
- Result caching — unchanged file batches are never re-analyzed (
.perflens-cache.json, content-hash keyed) - Cost tracking — every scan ends with a token + estimated cost summary
Installation
npm install --save-dev perf-lens
# or globally
npm install -g perf-lens
Requires Node.js ≥ 20 and Chrome (for Lighthouse).
Quick start
- Set your Anthropic API key (one of):
perf-lens config set-key YOUR_API_KEY
# or
export ANTHROPIC_API_KEY=YOUR_API_KEY- Start your dev server, then run a scan from your project root:
perf-lens scanPerfLens auto-detects the dev server port (from package.json scripts or common ports), runs Lighthouse, analyzes your code, and writes performance-report.md.
- Try agent mode:
perf-lens scan --agentCI gate
Fail the pipeline when serious issues appear:
perf-lens scan --fail-on critical   # exit 1 if any critical finding
perf-lens scan --fail-on warning    # exit 1 on critical or warning
CLI reference
perf-lens scan [options]

  -c, --config <path>          Path to config file
  -p, --port <number>          Development server port
  -t, --target <directory>     Directory to scan (default: current directory)
  -f, --max-files <number>     Maximum number of files to analyze
  -b, --batch-size <number>    Files per batch
  -s, --max-size <number>      Maximum file size in KB
  -d, --batch-delay <number>   Delay between batches (ms)
  -o, --output <path>          Report output path
  --format <type>              Output format: md or html
  --agent                      Agentic analysis (model investigates via tools)
  --fail-on <severity>         Exit 1 if findings at/above severity exist (CI gate)
  --no-cache                   Skip the analysis result cache
  --mobile                     Mobile emulation for Lighthouse
  --cpu-throttle <number>      CPU throttle multiplier
  --network-throttle <type>    slow3G | fast3G | 4G | none
  --timeout <number>           Lighthouse timeout (ms)
  --verbose                    Verbose output

perf-lens config set-key <key>   Save your Anthropic API key
perf-lens config get-key         Show the configured key (masked)
Configuration
PerfLens loads config via cosmiconfig: .perflensrc, .perflensrc.json|yaml|js, perflens.config.js, or a perflens field in package.json.
// perflens.config.js
export default {
  ai: {
    model: 'claude-opus-4-8', // default; use 'claude-haiku-4-5' for cheaper scans
    maxTokens: 16000,
  },
  thresholds: {
    performance: 90,
    lcp: 2500,
    cls: 0.1,
  },
  analysis: {
    targetDir: '.',
    maxFiles: 200,
    batchSize: 20,
    ignore: ['**/generated/**'],
  },
  lighthouse: {
    mobileEmulation: true,
    throttling: { cpu: 4, network: 'fast3G' },
  },
  output: {
    format: 'html',
    directory: './reports',
  },
};
A .perflensignore file (gitignore syntax) is also honored.
Model selection
The default model is claude-opus-4-8 (deepest analysis). For faster/cheaper scans set ai.model to claude-haiku-4-5; claude-sonnet-5 sits in between. Cost is printed after every scan so you can decide with real numbers.
API key resolution
PERF_LENS_ANTHROPIC_API_KEY → ANTHROPIC_API_KEY → ~/.perf-lens/config.json (written by config set-key).
Reports
- Markdown — metrics summary, Lighthouse insights, and findings grouped by severity (🚨 critical / ⚠️ warning / 💡 suggestion), each with description, impact, solution, and a corrected code example.
- HTML — the same content as a self-contained styled dashboard.
FAQ
Why not just hand my Lighthouse report to Claude Code or Cursor? For a one-off investigation, do exactly that. It works, and it's the same idea this tool is built on. PerfLens exists for the runs after the first one. A fresh agent explores differently every time and produces different findings in different formats, which makes it a flaky CI check. PerfLens pins that down: schema-enforced structured output, every reported file/line verified before it hits the report, content-hash caching so unchanged code produces identical results instead of a re-roll, severity-based exit codes for gating, and per-scan cost you can see and cap. Build that layer around your own agent pipeline and you also own the glue code, the prompt drift, and the pager.
How is this different from Lighthouse alone? Lighthouse measures and points at resources (bundles, requests, images). PerfLens continues the investigation into the code that produced them, and proposes the fix.
What does a scan cost?
You bring your own Anthropic API key and pay per scan; there's no service in the middle. Exact token usage and estimated cost are printed after every scan. Result caching means re-scans only pay for changed files, and you can set ai.model to claude-haiku-4-5 for cheap scans.
Where does my code go?
Directly to the Anthropic API, nowhere else. In agent mode, the model's file access is sandboxed to the target directory. Use .perflensignore to exclude anything you don't want analyzed.
Development
npm install
npm run build      # tsc + prompt templates
npm test           # vitest
npm run typecheck
npm run lint
Releases are automated with semantic-release on main.
License
MIT © Moiz Imran