
phantomflow
v1.3.0
Published
UI testing with PhantomCSS and Decision Trees


Readme
Unmaintained notice: As of December 22nd 2017 this project will no longer be maintained. What started out as a creative experiment four years ago became a significant tool in Huddle's Web development workflow, as well as the workflows of external Web engineers. But like PhantomCSS, its time to move on.
PhantomFlow
UI testing with decision trees. An experimental approach to UI testing, based on Decision Trees. A NodeJS wrapper for PhantomJS, CasperJS and PhantomCSS, PhantomFlow enables a fluent way of describing user flows in code whilst generating structured tree data for visualisation.
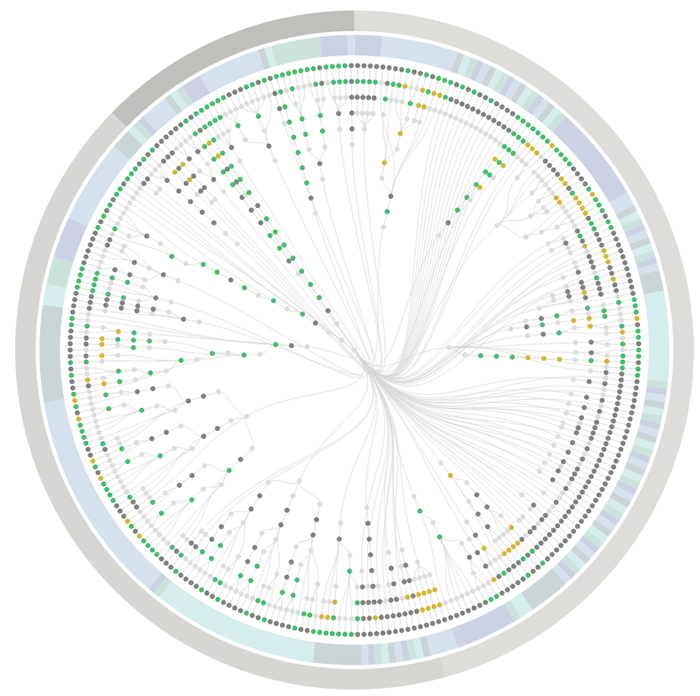
The above visualisation is a real-world example, showing the complexity of visual testing at Huddle.
Aims
- Enable a more expressive way of describing user interaction paths within tests
- Fluently communicate UI complexity to stakeholders and team members through generated visualisations
- Support TDD and BDD for web applications and responsive web sites
- Provide a fast feedback loop for UI testing
- Raise profile of visual regression testing
- Support misual regression workflows, quick inspection & rebasing via UI.
Install
- Install with git
$ git clone https://github.com/Huddle/PhantomFlow.git
$ cd PhantomFlow
$ npm install- As a NodeJS dependency
npm install phantomflow
See also
PhantomFlow also comes as grunt plugin! grunt-phantomflow
Try it!
node test/test.js- First run will create visual test baslines with PhantomCSSnode test/test.js- Second run will compare baseline visuals with the latest screenshots. This'll pass because there have been no changes.node test/test.js report- An optional step to load the Decision tree visualisation into your Web browsernode test/test.js dashboard- Run the tests in dashboard mode to see test progress (useful for many parallelised tests)

Mac OSX users should be aware that PhantomJS doesn't load the FontAwesome glyths used in the test suite, I don't understand why. I fixed this locally by downloading FontAwesome and double clicking on the .otf file to install the font.
There are two example test suites, these suites will be executed in parallel, the command line output is a bit muddled as a result.
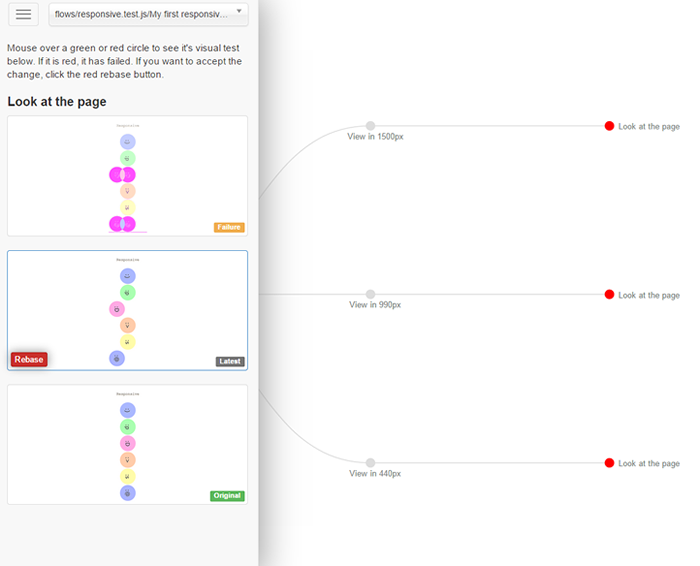
The D3.js visualisation opens with a combined view which merges the test decision trees. Click on a branch label or use the dropdown to show a specific test. Hover over the nodes to see the PhantomCSS screenshots. If there is a visual test failure the node will glow red, hover and click the node to show the original, latest and generated diff screenshots.
Test Example
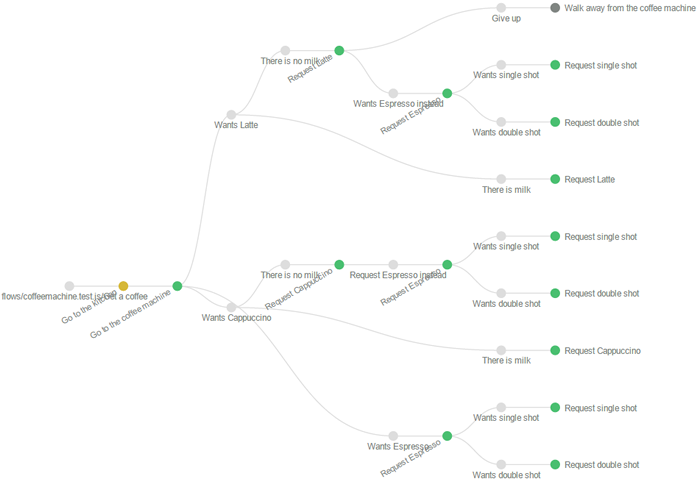
The demo describes a fictional Coffee machine application. Please note that test files must use the '.test.js' suffix.
flow("Get a coffee", function(){
	step("Go to the kitchen", goToKitchen);
	step("Go to the coffee machine", goToMachine);
	decision({
		"Wants Latte": function(){
			chance({
				"There is no milk": function(){
					step("Request Latte", requestLatte_fail);
					decision({
						"Give up": function(){
							step("Walk away from the coffee machine", walkAway);
						},
						"Wants Espresso instead": wantsEspresso
					});
				},
				"There is milk": function(){
					step("Request Latte", requestLatte_success);
				}
			});
		},
		"Wants Cappuccino": function(){
			chance({
				"There is no milk": function(){
					step("Request Cappuccino", requestCappuccino_fail);
					decision({
						"Request Espresso instead": wantsEspresso
					});
				},
				"There is milk": function(){
					step("Request Cappuccino", requestCappuccino_success);
				}
			});
		},
		"Wants Espresso": wantsEspresso
	});
});
And below is the visualisation generated by this simple feature test.
The visualisations
Deciding how to visualise this data is the hard part. It has to be readable and insightful. These visualisations are still evolving, it would be great to see contributions for better visualisations. Visit d3js.org for inspiration.
PhantomFlow methods
- flow (string, callback) : initialise a test suite with a name, and a function that contains Steps, Chances and Decisions
- step (string, callback) : a discrete step, with a name and a callback that can contain a PhantomCSS screenshot as well as CasperJS events and asserts.
- decision (object) : Defines a user decision. It takes an object with key value pairs, where the key is the label for a particular decision, and the value is the function to be executed. The function can contains further decisions, chances and steps
- chance (object) : The same as a decision but offers the semantic representation of a chance event, as opposed to a deliberate possible action by the user
NodeJS setup example
	var flow = require('../phantomflow').init({
		// debug: 2
		// createReport: true,
		// test: 'coffee'
	});

	// flow.report(); // Show report

	flow.run(function(code){
		process.exit(code); // callback is executed when PhantomFlow is complete
	});
NodeJs Methods
- run (callback) : Runs all the tests. Takes a callback which is executed when complete
- report () : Spins up a local connect server and loads a browser window with the visualisation generated on the last test run.
Options
- createReport (boolean) : Should a report/visualisation be built?
- casperArgs (string[]): optional arguments to pass into casper and PhantomJS, such as
--ignore-ssl-errors=true - debug (number) : A value of 1 will output more logging, 2 will generate full page screenshots per test which can be found in the test-results folder. Forces tests onto one thread for readability.
- earlyexit (boolean) : False by default, if set to true all tests will abort on the first failure
- hideElements (string[]) : array of element names that should be invisible in the final page, and in screenshots
- mismatchTolerance (number) : Mismatch tolerance defaults to 0.05%. Increasing this value will decrease test coverage
- includes (string) : Defaults to 'include', it is the root directory of custom global includes (within the PhantomJS domain)
- port (number) : Defaults to 9001, this is the port that will be used to show the report/visualisation
- results (string) : Defaults to 'test-results', it is the root directory of the test results
- reports (string) : Defaults to {results} + '/report/', it is the root directory of generated reports, useful for proxying the reports
- remoteDebug (boolean) : Enable PhantomJS remote debugging
- remoteDebugAutoStart (boolean) : Enable autostart for PhantomJS remote debugging
- remoteDebugPort (number) : Defaults to 9000, the port on which Web Inspector will run
- skipVisualTests (boolean) : If set to true the visual comparison step will not be run
- test (string) : Test run filtering with a substring match
- tests (string) : Defaults to 'test', it is the root directory of your tests
- threads (number) : How many processes do you think you can parallelise your tests on. Defaults to 4.
Parallelisation
Test execution is parallelised for increased speed and a reduced test to dev feedback loop. By default your tests will be divided and run on up to 4 spawned processes. You can change the default number of threads to any number you think your machine can handle.
Debugging
Debugging is often a painful part of writing tests with PhantomJS. If you're experiencing trouble try the following.
- Enable debug mode 1, to show more logging. This will also prevent parallelisation - better for readability, but slower.
	var flow = require('../phantomflow').init({
		debug: 1
});- Enable debug mode 2, same as mode 1 but will also generate full-page screenshots per step, to allow to see what's actualy going on.
	var flow = require('../phantomflow').init({
		debug: 2
});- PhantomJS provides remote debugging functionality. This setting allows you to use the debugger; statement and add breakpoints with the Web Inspector interface. Remote debugging can be use in conjunction with the debug modes described above.
	var flow = require('../phantomflow').init({
		remoteDebug: true
		// remoteDebugAutoStart: false
		// remoteDebugPort: 9000
	});
Rebasing visual tests
Rebasing is the process of deleting an original visual test, and creating a new baseline, either by renaming the diff image, or running the test suite again to create a new image. The PhantomFlow UI provides a quick way to find and inspect differences, with a 'rebase' button to accept the latest image as the baseline.
Coverage
PhantomFlow will look for a __coverage__ property on the window object at the end of each test flow. If found the coverage data will be exported to the coverage directory under test-results (or wherever you have set result root folder) as JSON files with the extension .coverage.json. PhantomFlow doesn't handle coverage data itself, but if you've instrumented your application code using a tool like babel-plugin-coverage the exported data can be fed directly into Istanbul. e.g.
istanbul report --include test-results/coverage/**/*.coverage.json --dir coverage htmlWhat next?
We've been using this testing style for many months on Huddle's biggest UI application. It's still an evolving idea but for those of us that actively worked on it, it's making a huge difference to the way we think about UI, and how we communicate about UI. It supports TDD well, we use it for 'unit' testing UI but it has great potential for end-to-end as well. I'd also like to do more work on the visualisations, they look great and are very communicable, but they could be a better. Of course, this is an Open Source project and it would be great to see contributions.
Created by James Cryer and the Huddle development team.