
pi-gauge
v0.3.1
Published
pi extension: live LLM latency (TTFT) and throughput (tokens/sec) in the status bar


Readme
pi-gauge


Live LLM speed in pi's status bar — throughput (tokens/sec) and latency (time-to-first-token) at a glance, updating while the model streams.
v0.1.0 work-in-progress — status-bar format may change before 1.0.
Check out my other Pi extensions
— Auto-syncs Pi theme with OS dark/light mode.
— Real-time prompt cache hit rates and token metrics.
— Session task checklist with dependencies and a TUI renderer.
— Prunes verbose tool outputs from context while preserving history.
— Dot-grid visualization of context window token usage.
— Live tokens/sec and TTFT in the status bar.
— Tracks subscription quotas and rate limits across AI providers.
What you get
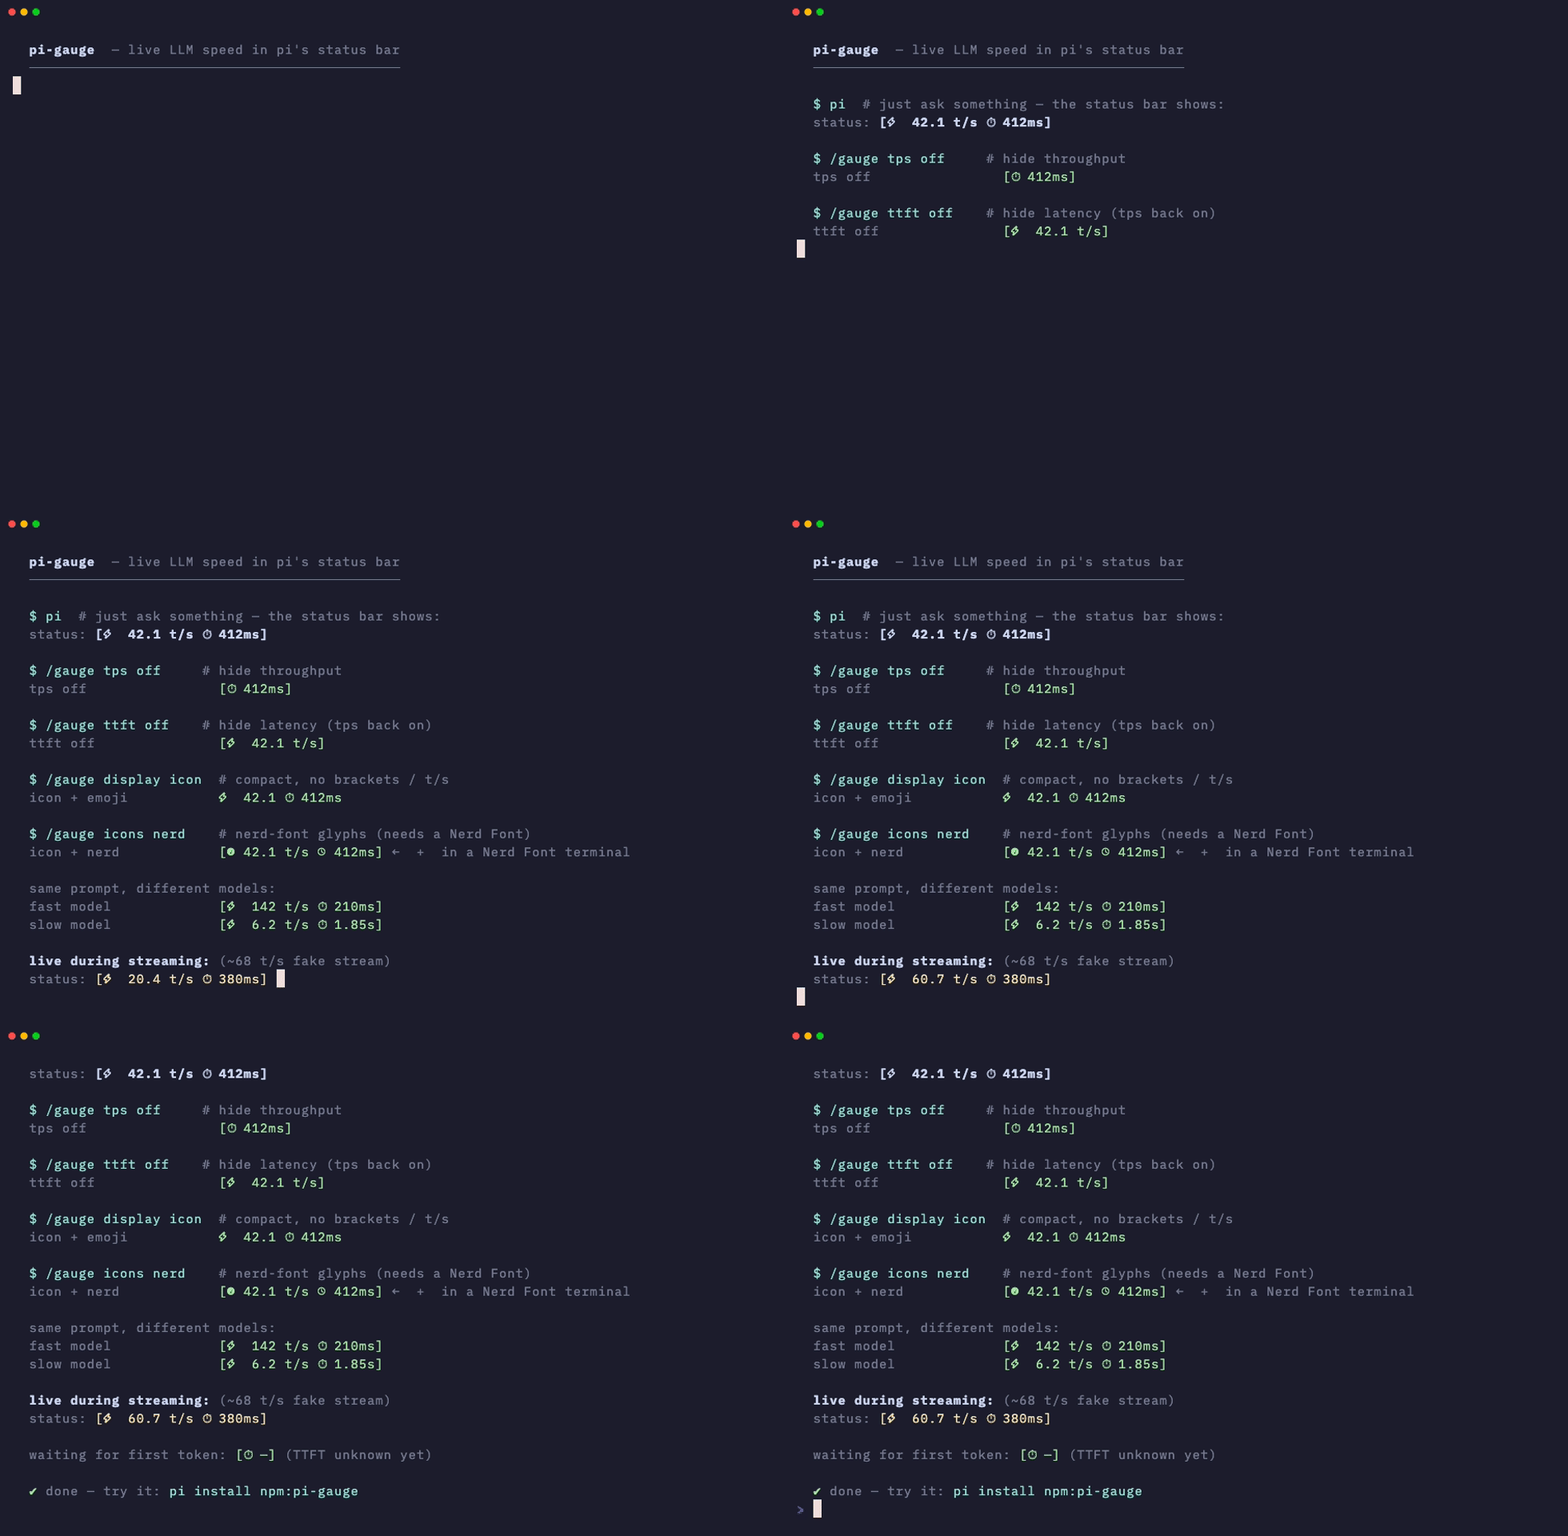
Just ask something in pi and the status bar shows a little pill like this:
[⚡ 42.1 t/s ⏱ 412ms]⚡ 42.1 t/s— how fast tokens are arriving⏱ 412ms— how long you waited for the first token (TTFT)
It ticks live during streaming, then settles on the final numbers. Waiting for the first token? You'll see [⏱ —] until it arrives.
Install
pi install npm:pi-gaugeRequires a pi coding agent with extension support. Settings persist to ~/.pi/agent/pi-gauge.json.
How it looks with different settings
All examples below are the exact strings the extension renders (same renderText the status bar uses), for one identical reply — 84.2 tokens in 2 s with 412 ms TTFT — unless noted.
Default (pill + emoji)
$ /gauge
pi-gauge: tps=on ttft=on mode=e2e display=pill icons=emoji

status:  [⚡ 42.1 t/s ⏱ 412ms]
Hide one metric
/gauge tps off      →   [⏱ 412ms]        # latency only
/gauge ttft off     →   [⚡ 42.1 t/s]     # throughput only
Turn both off and the gauge hides itself (status cleared).
Compact mode (no brackets, no t/s)
/gauge display icon

status:  ⚡ 42.1 ⏱ 412ms
Back to default with /gauge display pill:
status: [⚡ 42.1 t/s ⏱ 412ms]Icon sets: emoji vs Nerd Font
/gauge icons emoji   (default — works everywhere)

status:  [⚡ 42.1 t/s ⏱ 412ms]
/gauge icons nerd (needs a Nerd Font in your terminal)
status: [ 42.1 t/s 412ms]The nerd glyphs are tachometer U+F0E4 for t/s and clock U+F017 for TTFT. If you see boxes, your terminal isn't using a Nerd Font — switch back with /gauge icons emoji.
Combine them freely — compact + nerd is the minimal look:
/gauge display icon
/gauge icons nerd
status: 42.1 412msFast vs slow models (same prompt)
fast model:   [⚡ 142 t/s ⏱ 210ms]
slow model:   [⚡ 6.2 t/s ⏱ 1.85s]    # durations ≥1s render as seconds
Number formatting: t/s shows one decimal below 100 (42.1), whole numbers at/above (142). Durations show ms under a second, s with two decimals above (1.85s).
Measurement modes: e2e vs stream
Same reply (100 tokens, 412 ms TTFT, 2 s total), two ways to count:
mode=e2e:     [⚡ 50.0 t/s ⏱ 412ms]   # tokens ÷ whole request (request → message_end)
mode=stream:  [⚡ 63.0 t/s ⏱ 412ms]   # tokens ÷ streaming only (first token → message_end)
e2e (default) answers "how long did I wait overall?" — comparable across providers. stream answers "how fast does it feel once it starts?" — TTFT is identical either way, only the t/s denominator changes.
Provider note: Anthropic/Google stream cumulative usage, so live t/s is exact. OpenAI usually sends usage only in the final chunk, so the live number is a chars÷4 estimate that snaps to the exact value at
message_end.
The /gauge command
Bare /gauge in the TUI opens a bordered settings dialog with all five
settings as toggle rows, a live demo preview (mocked reply: 84.2 tokens in
2 s, 412 ms TTFT) so you can see each change as you make it, and a
● unsaved flag in the title while edits are uncommitted. ↑↓ move,
←→/space/enter toggle, ctrl+s saves (persists to
~/.pi/agent/pi-gauge.json and re-renders the status bar), esc exits
without saving. Outside the TUI (or with subcommands) the classic
notify-based behaviour is unchanged. Subcommands and their values
tab-complete in the TUI (/gauge m → mode, /gauge mode → e2e|stream).
| Command | What it does |
|---|---|
| /gauge | Open settings dialog (TUI) / show current settings (otherwise) |
| /gauge tps on\|off | Show/hide throughput (throughput also works) |
| /gauge ttft on\|off | Show/hide latency (latency also works) |
| /gauge mode e2e\|stream | Switch the t/s denominator |
| /gauge display pill\|icon | Bracketed pill vs bare compact |
| /gauge icons emoji\|nerd | Emoji glyphs vs Nerd Font glyphs |
| /gauge graph [model] | History chart: per-call TPS + TTFT bars for this session (TUI overlay; text summary elsewhere). ←→ cycles the model filter, ↑↓/PgUp/PgDn scroll, esc closes |
Every change saves immediately and re-renders the status bar if metrics exist.
History graph (/gauge graph)
Every assistant reply also appends one small record
(pi-gauge-sample: model, tokens, TTFT, e2e/stream durations) to the session
JSONL via appendEntry — invisible in the transcript, zero LLM context cost,
and it survives session resume. /gauge graph renders it:
- TUI: bordered overlay with per-call TPS bars (denominator follows your
mode e2e|streamsetting) stacked over per-call TTFT bars, footer averages,←→cycles the model filter (all → model…),↑↓/PgUp/PgDnscroll long sessions,esccloses./gauge graph gpt-5.4pre-filters. - Outside the TUI (
--print, rpc/json): prints a per-model text summary (calls, avg t/s, avg TTFT) instead of the overlay.
Sessions from before this feature simply show "no samples yet".
How it works
before_provider_request ──► first token ──► …streaming… ──► message_end
        │ TTFT = ──────────┘                                    │
        └────────────── e2e duration ───────────────────────────┘
└────── stream duration ──────────┘- Request start is anchored on
before_provider_request, TTFT ends at the first*_delta, totals snap to exactusage.outputatmessage_end. - Status writes are throttled (~4/sec) so fast streams don't spam the UI.
- State re-anchors on every LLM call (tool loops make several per turn); aborted/empty streams keep partial metrics instead of crashing.
Dev
npm install
npm run build   # src/*.ts → dist/ (dist/ is COMMITTED — pi installs with --omit=dev and no build step)
npm test
Regenerating the demo GIF
The GIF at the top is recorded with VHS (Charm's terminal-screen recorder — you write a .tape script, it types the commands in a headless terminal and exports a .gif).
- Script:
vhs/demo.mjs— imports the realrenderTextfromdist/, so the GIF can never drift from what the status bar shows. - Tape:
vhs/gauge.tape— font, theme, window size, and timing. - Output:
assets/demo.gif
brew install vhs ffmpeg   # once
npm run build             # demo imports from dist/
vhs vhs/gauge.tape        # → assets/demo.gif (~17 s)
License
MIT © 2026 Arnav Gupta