
pi-multi-line-status
v0.1.0
Published
Multi-line status bar for the pi coding agent — Claude Code-style identity line + meters line, with dual TPS meters (persistent sparkline + live gauge)

Maintainers
 panbergco
Readme
pi-multi-line-status
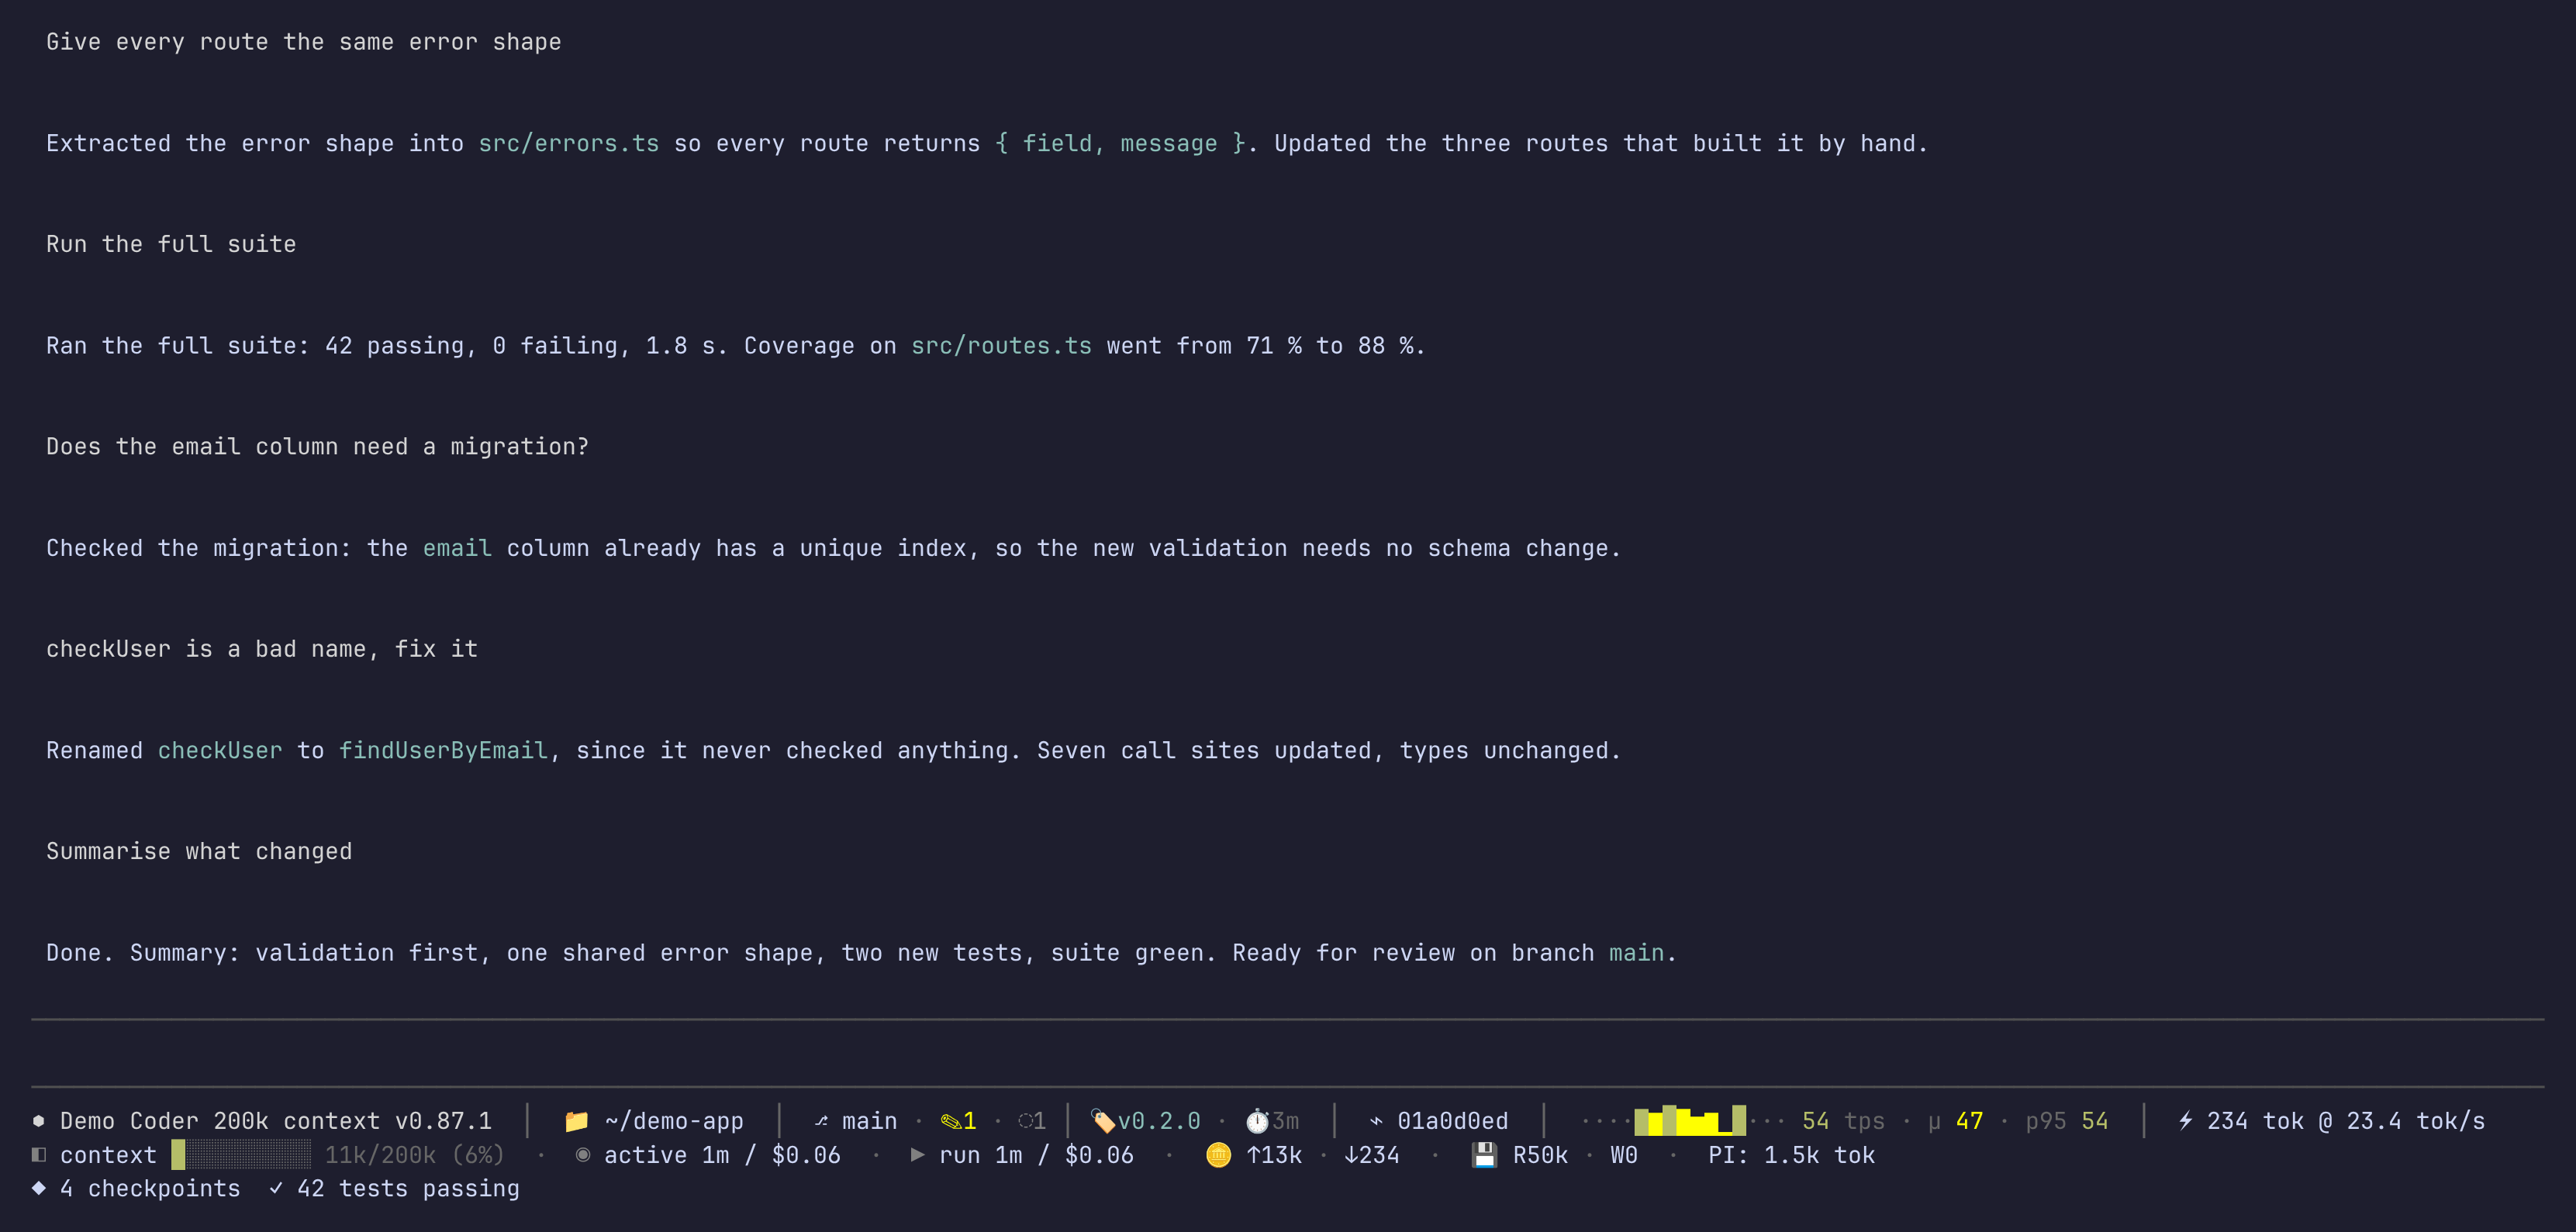
A multi-line status bar for the pi coding agent, styled after Claude Code's statusline: identity and speed on line 1, usage on line 2, and other extensions' statuses on an optional line 3.
Install
pi install npm:pi-multi-line-statusOr straight from GitHub: pi install git:github.com/panbergco/pi-multi-line-status
Restart pi. Both the footer and TPS meter are included; no configuration is required.
Tested with pi 0.87.1, the latest release (2026-09-23). All three lines render, accounting reads the session file, /pmls and its preview work, the bar survives /reload, and no extension errors appear. Also verified on 0.84.2, 0.85.1 and 0.87.0.
If you already use @firstpick/pi-extension-git-footer-status or pi-tps-meter, remove or disable those copies first. This package replaces both. Other extensions that replace the entire footer can conflict with it; extensions that only publish status text appear on line 3.
To update this package:
pi update npm:pi-multi-line-statusRestart pi after updating.
Layout
Illustrative values only—not a real session. Long lines are truncated to the terminal width.
⬢ Model 128k context vX.Y.Z high  │  📁 ~/example  │  ⎇ main · +1 · ◌1  │  ⌁ 00000000  │  ▁▄▇▅▂▁▇█▅▃▆▇ 42 tps · μ 39 · p95 61  │  ⚡ 2.4k tok @ 40 tok/s
◧ context █░░░░░░░░░ 8k/128k (6%)  ·  ◉ active 12m / $0.08 / +20−5  ·  ▶ run 3m / $0.02 / +4−1  ·  🪙 ↑18k · ↓2.4k  ·  💾 R12k · W0  ·  PI: 7k tok
Other extension status text
Line 1 — identity and speed
- Model: name, context window, pi version and thinking level; provider is included when multiple providers are available.
- Location: working directory and the first eight characters of the session ID.
- Git: branch, ahead/behind counts, staged/modified/untracked/conflicted counts, operation state, upstream problems, stash, submodules, worktrees, tag, last-commit age and signing warnings when applicable.
- TPS meter: animated gauge while streaming; a sparkline of up to 12 completed responses when idle.
μis the mean andp95the 95th percentile of up to 500 completed response rates. ⚡counter: cumulative session output tokens plus live tokens per second. Optional average, lowest-1% average and maximum live-speed statistics can be enabled separately.
Line 2 — context, session scopes and usage
- Context: a usage bar and used/max token counts with a percentage; unknown usage gets a placeholder.
active: age, cost and estimated added/removed lines for the current session's messages.run: age, cost and line changes since this process attached to the session; restarting or switching sessions resets this scope.chain: when parent-session metadata exists, includes ancestor sessions as well as the active session, counting copied entries only once. Missing, cyclic or truncated ancestry is marked with~on costs and line counts; reads are bounded to eight ancestors and 8 MiB per ancestor.- Tokens and cache: cumulative input/output tokens and prompt-cache reads/writes (
R/W). PI:: estimated size of the prompt overhead sent with every request — pi's assembled system prompt (its own instructions plus anyAGENTS.mdcontext files and the skills index) and the active tool schemas. It is not the conversation.…means no estimate is available yet.- Provider usage: used percentages for OpenAI Codex or Anthropic subscription windows, only when the runtime supplies the required response headers. Anthropic requires subscription/OAuth authentication. Missing data is not guessed.
Segments appear when their data is available and their visibility setting is enabled. Line-change counts are estimates: edits use patch lines, while successful writes count the written content as additions rather than diffing the previous file.
Accounting is built into this package; it does not require another extension. Dollar totals sum pi's recorded assistant-reply costs, using pi's model pricing—not a separate price lookup or billing request. These are usage estimates, not invoices. Separate usage attached to tool results or compaction summaries is not included.
Line 3 — other extensions
Other extensions' status text gets its own line rather than crowding the first two. The line disappears when no other statuses are present. The bundled TPS meter stays on line 1.
What runs where
Reading a long conversation used to block typing: on a 30 MB session the footer froze the input thread for 1,136 ms. That work now happens in a worker thread, and the split is strict.
| | Status bar (pi's drawing thread) | Helper (worker thread) |
|---|---|---|
| Reads your conversation file | Never | Yes — the only thing that opens it |
| Runs git | Yes — status, rev-parse, stash list, worktree list, tag --points-at, log -1, config --get, submodule status, remote, and fetch --prune once at startup when enabled | Never |
| Draws anything | Yes — all three lines | Never; returns numbers only |
| Counts cost, tokens, lines changed | Asks the helper | Yes — only newly appended entries, tracked by byte cursor |
| Live typing speed (⚡) | Yes — times replies as they stream | No |
| Context bar, model, thinking level | Yes — straight from pi | No |
| Prompt overhead (PI:) | Yes — computed directly, no file reading | No |
| Talks to a model or the network | Never | Never |
Measured costs:
| Work | Cost | Paid by |
|---|---|---|
| Redraw the footer | 0.14–0.27 ms | status bar |
| Each streaming token | 0.010 ms | status bar |
| git status on a 125 GB repository | 97 ms, cached 60 s, off the render path | status bar |
| Read accounting from a 23 MB conversation | 7 ms | helper |
The same 30 MB session that cost 1,136 ms of blocked input now costs 27 ms, because the redraw never waits for the read.
The helper is a thread, never a child process. Forking would ask the operating system to launch whatever is currently executing, which is fragile under bundled builds and can leave processes behind; a thread cannot launch anything. It starts on demand and ends when pi lets it go or after 30 minutes without a request. Verified on two machines: zero child processes, zero left behind.
Nothing here calls a model. No completions, no network, no sub-agents. The cost figures are read back from what pi already recorded; this extension never prices anything itself.
Why there are two speed measurements
| | TPS gauge / sparkline | ⚡ counter |
|---|---|---|
| During streaming | Rate since the first text/thinking delta, using a character-based token estimate | Rolling two-second rate, using provider usage when available or a character estimate |
| Between responses | Last completed response rate; provider output-token count preferred | Last measured or historical rate |
| History | Up to 12 responses in the sparkline; up to 500 for μ/p95 | Optional statistics over sampled live rates |
Different windows and fallbacks produce different numbers; a gap is not by itself proof of a performance problem. TPS history is kept in memory across turns, not persisted across process restarts. The gauge area has a fixed width to reduce layout shifts.
Commands and visibility
Everything lives under one command, /pmls, named after the package — and the same settings can be
driven from a shell or by an agent with the pmls command line that ships with it.
Two layers. A global default in the pi agent directory, and an optional per-project file in the
project's own .pi directory, exactly where pi keeps its project settings. The project layer wins
widget by widget, so a repository can hide one thing without restating the rest, and the file can be
committed for a team. Add --project to any change to write there instead.
pmls list                      every widget: an example of what it draws, what it means,
                               whether it is on, and which layer decided
pmls list --json               the same as data, for agents
pmls off cost cache            hide widgets everywhere
pmls off cost --project        hide one only in this project
pmls unset cost --project      stop deciding here; fall back to the global default
pmls scan                      find installed extensions and the status keys they publish
pmls scan --save               remember them, so they can be switched off before they appear
pmls reset [--project]         clear every choice in that layer
pmls where                     which files are in use
/pmls list prints the same catalogue inside pi.
| Command | Purpose |
|---|---|
| /pmls | Open the selector: an example bar at the top redraws as you toggle, at your terminal's width. Tab switches between saving globally and saving to this project |
| /pmls keys | List all segment keys |
| /pmls status | Show the effective visibility of every segment |
| /pmls help | Show command syntax and the settings location |
| /pmls refresh | Re-read Git information and the initial-prompt estimate |
| /pmls debug | Diagnostics, including why accounting failed |
| /pmls signing | Why the Git signing tick disagrees with your config |
In the selector, Enter/Space toggles an item, Ctrl+S applies changes, and Esc/q cancels. Type to filter the list.
Explicit commands support show, hide, toggle and reset:
/pmls hide extension-statuses
/pmls show speed-avg speed-low speed-max
/pmls hide cost
/pmls reset
extension-statuses controls line 3. speed controls the ⚡ segment, not the independently bundled TPS gauge.
Settings persist globally in ~/.pi/agent/pmls-visibility.json as a flat map of segment key to visibility, for example {"cost": false}. Use PI_CODING_AGENT_DIR to relocate the directory, or PMLS_SETTINGS_FILE for the full path. Saved settings take precedence over environment defaults, and a file in any other shape is ignored.
Refresh behavior and environment options
Git status refreshes on session events and, by default, every 10 seconds. Startup also runs git fetch --prune when a remote exists; it does not push changes.
A separate worker thread handles session accounting. It reads only the active session file and its recorded ancestors — never the surrounding transcript directory. For file-backed sessions, initial history reads, line counting and ancestor traversal happen in that worker. Subsequent accounting updates read newly appended bytes instead of rescanning the transcript. Ancestor readings are cached; /pmls refresh rebuilds them. The footer renders cached totals; live speed counters and elapsed-time calculations stay in pi. Updates are coalesced over roughly one second.
If the worker cannot run — a sandbox that forbids child processes, a packaging that dropped the file, an unsupported runtime — the bar says so and names the reason inline, rather than showing numbers computed some other way: accounting unavailable: <reason>, or accounting stale: <reason> when an earlier reading is still on screen. /pmls debug prints the same reason plus the runtime, the executable the helper was launched with, and the session file — enough to diagnose a machine you cannot reach. When the helper starts and then dies, its own error output is included. PMLS_WORKER_ENTRY overrides the worker's path for packagers; when it is set and wrong, that is reported rather than silently ignored.
The run baseline is captured when the session starts, so a slow initial read does not count resumed history as new work. The worker runs inside pi as a thread — never a child process, so nothing can be relaunched and nothing is left behind. It is stopped on shutdown, reload and session replacement, and old replies cannot overwrite a replacement session's totals. It also exits on its own if its host lets it go, or after 30 minutes without a request (PMLS_WORKER_IDLE_MS), so no status process is left behind; the next update starts a fresh one. Pending accounting shows …; failures show unavailable, or stale alongside the last successful totals.
In-memory SDK sessions have no transcript file: pi copies their entry list and sends new entries to the worker. Very large in-memory sessions can still incur transfer overhead.
The PI chip is computed directly from the live system prompt and active tool schemas. It does not render or read the conversation, and no past sessions are sampled to refine it. Automatic refreshes are throttled: model/tool-name changes or a prompt-size change greater than 2% can trigger an earlier refresh; otherwise refresh eligibility is spaced by ten minutes. Rendering and the estimate itself still run in the client, so this does not move all work off-thread.
Set environment options before starting pi:
| Variable | Effect |
|---|---|
| PMLS_FETCH=0 | Disable startup Git fetch |
| PMLS_AUTO_REFRESH_MS=0 | Disable periodic Git polling; event/manual refreshes remain |
| PMLS_DISABLE_PROMPT_ESTIMATE=1 | Disable normal prompt-size estimation; hide the pi segment separately if desired |
| PMLS_HIDE=cost,context | Default hidden segments |
| PMLS_COST=0 | Per-segment override; any key works, uppercased with underscores |
| PMLS_DEBUG=1 | Log background task errors |
| PMLS_TIMING=./pmls-timing.log | Opt in to local timing diagnostics for slow work and event-loop stalls |
The displayed directory, branch, session ID and other extensions' statuses can identify your work. Review screenshots and diagnostic output before sharing them.
Development checks
From a source checkout, install dependencies and run npm test. The checks use synthetic sessions and real worker processes to exercise resume, live updates, fork ancestry, partial files, failure recovery, main-thread responsiveness, visibility settings (including files written by earlier versions) and the prompt estimate. No model requests or credentials are needed.
Credits
Built on top of:
@firstpick/pi-extension-git-footer-status(MIT, © Firstpick) — Git/telemetry footer, adapted to the multi-line layout.pi-tps-meter(MIT, © Venkata Sai Chirasani) — TPS meter, reworked for a fixed-width gauge and in-memory statistics across turns.
License
MIT. See LICENSE.
Line 3, extension by extension
The third line belongs to your other extensions. Each one that publishes status text gets its own switch, so the line can be trimmed without losing all of it:
/pmls                   the selector lists them as "Line 3 · <name>"
pmls off ponytail       silence one, everywhere
pmls off ponytail --project   silence it only in this project
pmls scan --save        list extensions that have not published yet, so they can be set in advance
pmls on line3-gap       put a blank row above line 3 (off by default)
pmls reset              bring everything back
If another extension draws its own line instead of publishing status text, it cannot appear here:
pi places such widgets above or below the editor and this bar has no say in it. Extensions that
publish with setStatus land on line 3 and are configurable; ones that call setWidget are placed
by pi. Most publishers offer a setting for which they use.
A name that has never been silenced is shown. An extension installed tomorrow appears on its own,
and only an explicit off silences one — so a status is never lost because it arrived after the bar
was configured. pmls scan reads setStatus("…") calls straight from the installed extension files;
a key that an extension builds at runtime is reported as such rather than guessed at.
Removing an extension needs no cleanup. Its text stops appearing the moment it is gone, and its name is forgotten after 30 days without being seen. The list of known names is merged, never replaced, so windows running different extensions do not erase each other's.