
pi-stats-dashboard
v0.1.3
Published
Local usage and behavior dashboard for Pi agent sessions

Maintainers
 suryavamsi06
Readme
pi-stats-dashboard
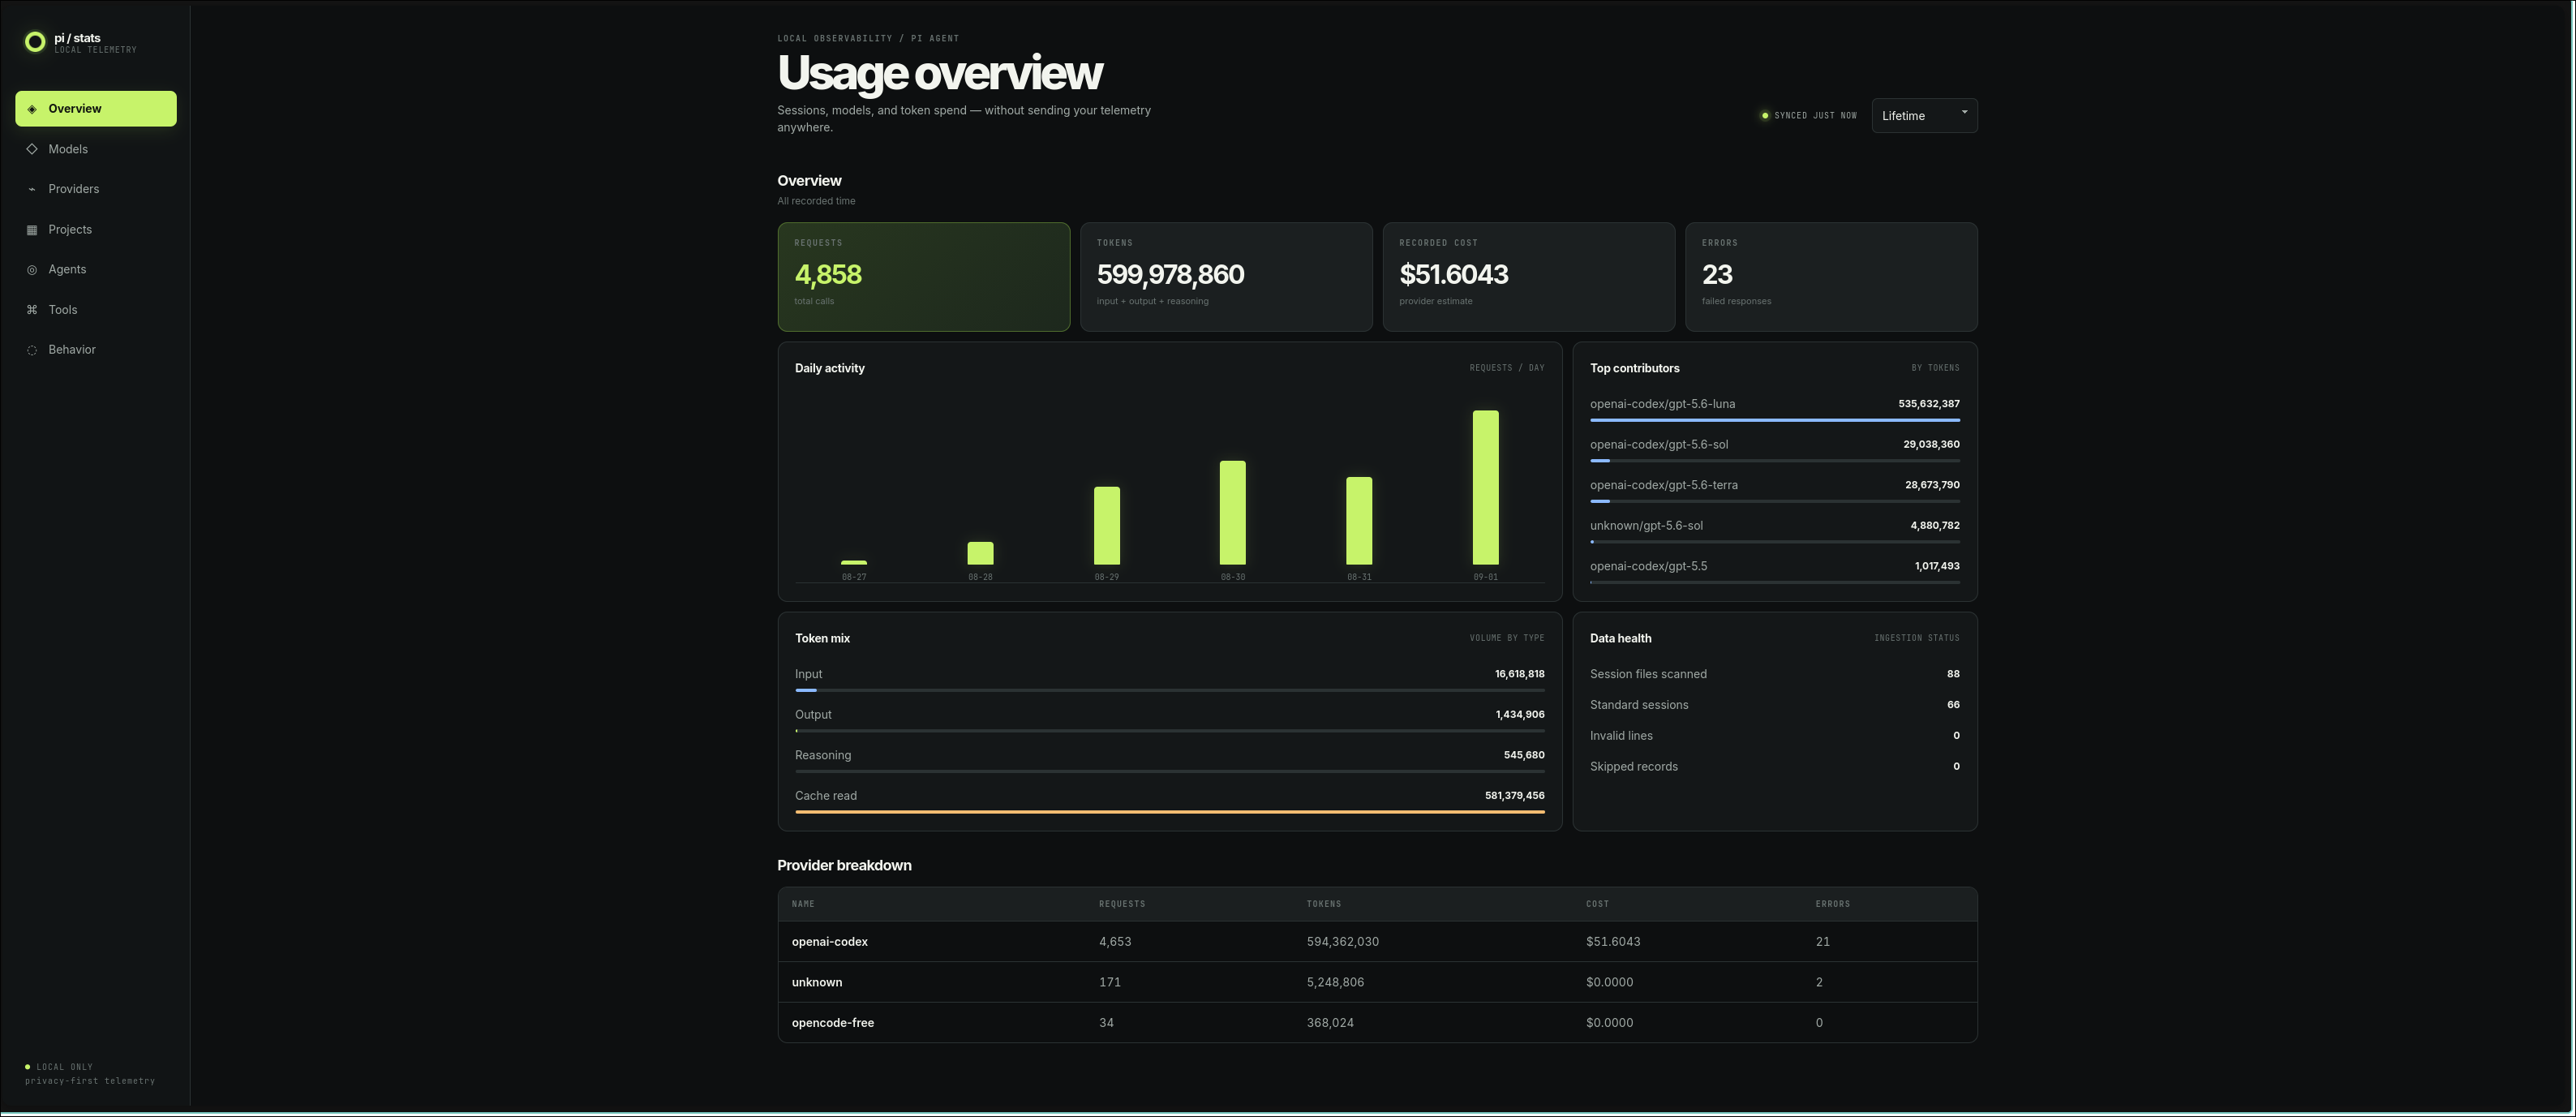
A local, privacy-first /stats dashboard for Pi. It reads Pi's persisted JSONL sessions and opens a browser dashboard with lifetime, today, 7-day, and 30-day usage.
GitHub repository · npm package
Install
pi install npm:pi-stats-dashboardThen run Pi and use /stats.
Included metrics
- Input, output, reasoning, cache read/write, total tokens, recorded cost, requests, and errors
- Daily activity and breakdowns by model, provider, project, agent, and tool
- Local-only behavior counters for user messages: yelling, profanity, anguish, correction, repetition, and blame
- Malformed-record diagnostics
Costs are the values recorded by providers and may be zero or unavailable. They are estimates, not invoices. Pi does not persist reliable historical latency, TTFT, tokens/sec, or subscription-window data, so those are intentionally not fabricated.
The server binds to 127.0.0.1, uses a random URL token, and returns aggregate data only. Prompt and response text is never retained or returned; behavior analysis happens in memory.
NixOS
Requires Pi to be installed separately.
Add the flake and module to your NixOS configuration:
inputs.pi-stats-dashboard.url = "github:suryavamsi6/pi-stats-dashboard";

modules = [
  inputs.pi-stats-dashboard.nixosModules.default
];

programs.pi-stats-dashboard.enable = true;
Apply the configuration, then register the package with Pi:
sudo nixos-rebuild switch --flake .#your-hostname
pi install /run/current-system/sw/share/pi-stats-dashboard
For a one-off install without the module:
pi install "$(nix build --no-link --print-out-paths github:suryavamsi6/pi-stats-dashboard)"Development
pi -e .
npm test
npm run check
npm pack --dry-run
This package intentionally uses Node built-ins and no runtime dependencies. The generated tarball is publish-ready; npm publication and repository creation are not automated.