
pi-tail
v0.6.1
Published
A real-time terminal visualizer for pi agent telemetry logs.


Readme
pi-tail
pi-tail is a lightweight, zero-dependency real-time web visualizer designed to monitor telemetry logs generated by pi-logger. Running completely out-of-process to keep your agent non-blocking and failure-resilient, it scans your active workspace for .pi/logs/, starts a local background server, and streams live JSONL events directly into a responsive, user-friendly browser dashboard via Server-Sent Events (SSE).
Why a Separate Package?
pi-tail is intentionally decoupled and packaged separately from pi-logger for two core reasons:
- Non-Blocking Reliability: Running the visualizer out-of-process ensures that log rendering and web server overhead never block or slow down the agent. Furthermore, if the agent process crashes unexpectedly, the logs remain safely accessible so you can instantly diagnose what went wrong.
- User-Friendly Experience: Rather than parsing raw JSON lines directly in the terminal,
pi-tailprovides a clean, searchable, and interactive web dashboard to look at logs effortlessly.
Prerequisites
pi-tail requires telemetry logs generated by pi-logger. Make sure you have pi-logger installed and active in your project workspace so that telemetry data is actively written to .pi/logs/.
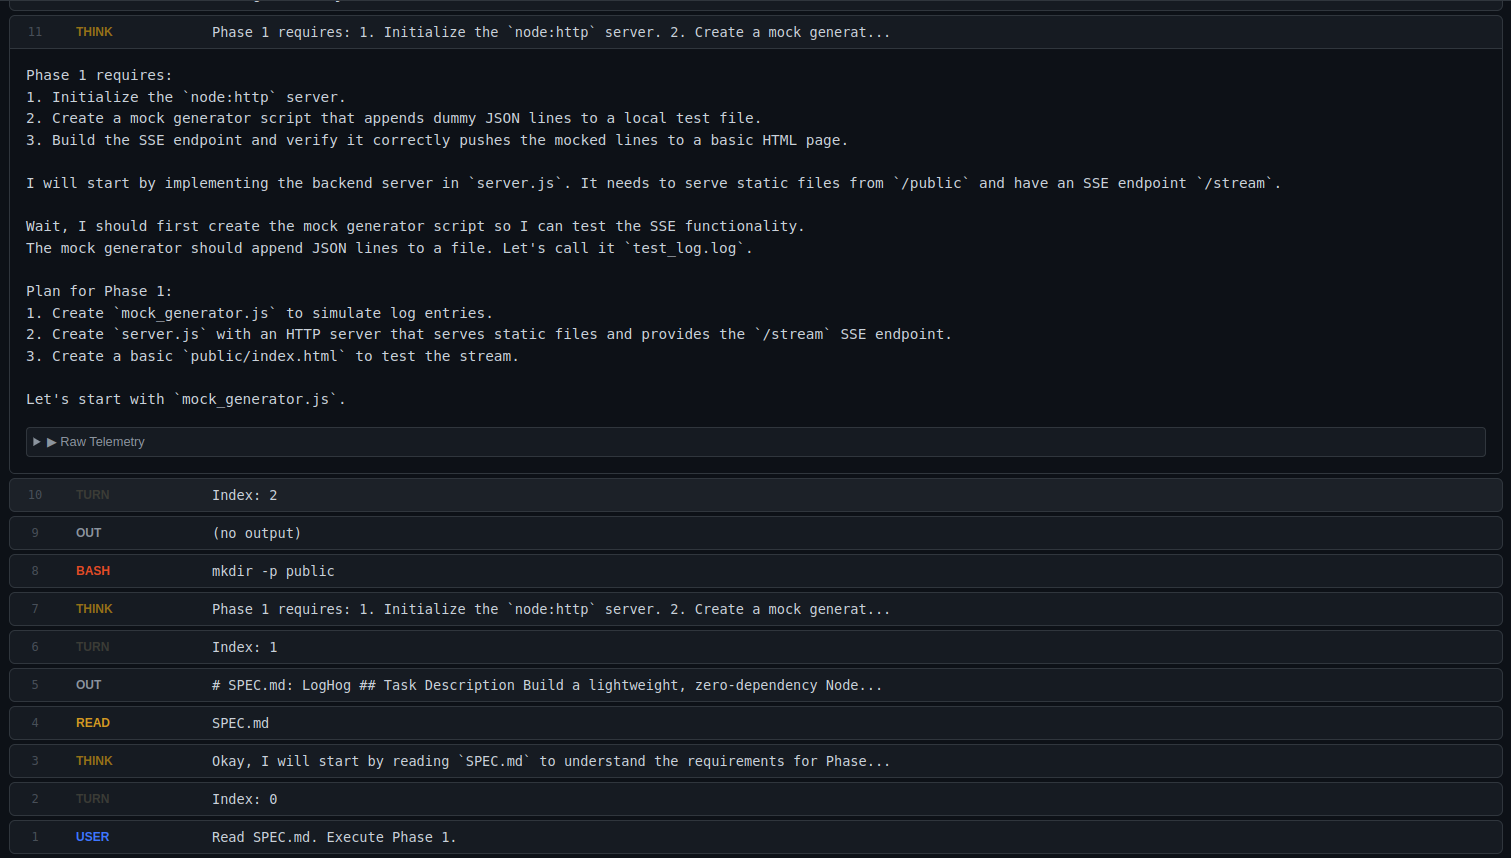 Chronological feed view with expandable telemetry details.
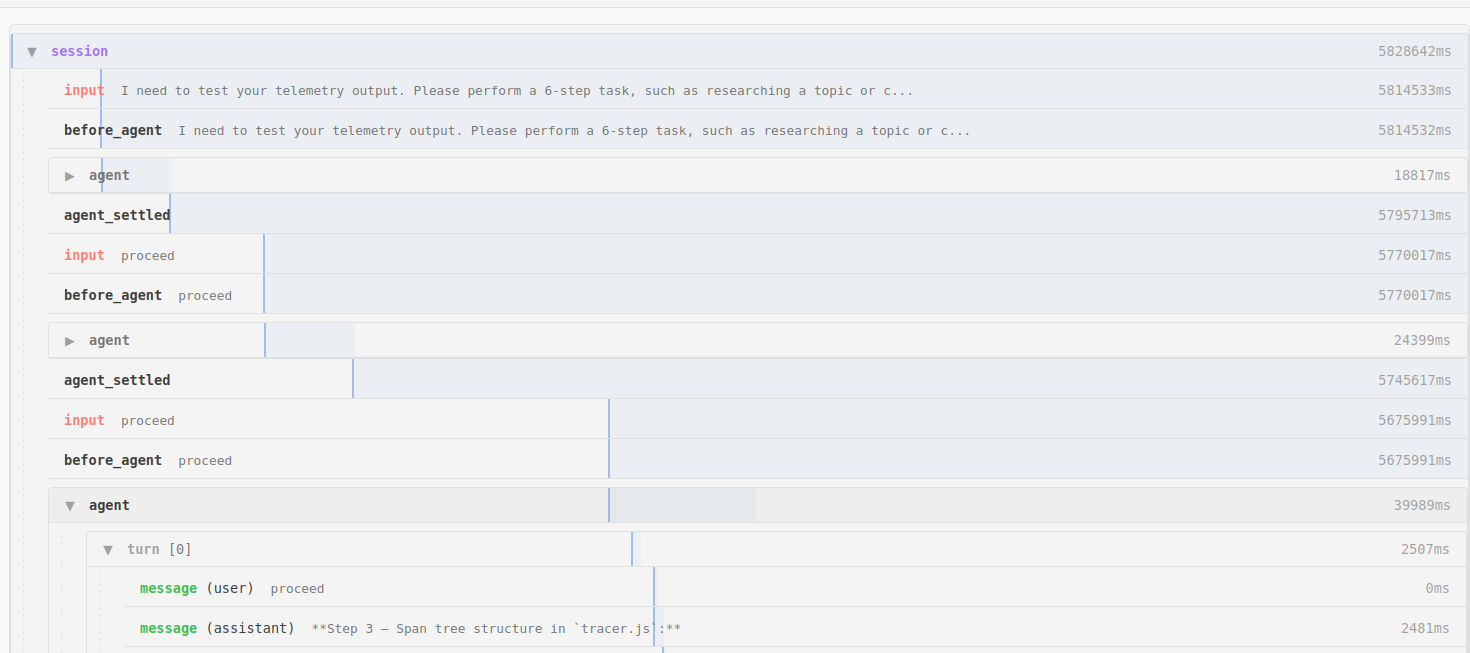 Hierarchical trace visualization with inline Gantt charts.
Features
- Zero Dependencies: Built entirely with native Node.js modules (
node:http,node:fs,node:path,node:util). No heavy build tools, frameworks, or external libraries required. - Dual-View Architecture: Seamlessly toggle between a flat, chronological event feed and a hierarchical execution trace view without page reloads.
- Hierarchical Trace Visualization: Dynamically reconstructs parent-child execution trees in memory. Renders collapsible nodes paired with inline CSS Gantt charts to map execution duration.
- Real-Time Metrics HUD: A persistent, sticky dashboard ribbon that intercepts telemetry snapshots to display live input, output, and reasoning token counts, alongside tool error rates.
- Interactive Modals: Utilizes native HTML5
<dialog>elements for on-the-fly, deep-dive inspections of raw JSON payloads. - Interactive Sidebar: Switch between multiple historical log sessions instantly. The UI automatically clears and resets to prevent data bleeding.
- DOM Memory Protection: Automatic node culling keeps the memory footprint low during long-running agent executions.
- Customizable Port: Easily run on alternative ports if port 3000 is occupied.
Installation & Usage
You don't even need to install pi-tail globally! Navigate to any project directory where pi-logger has initialized telemetry logs (.pi/logs/), and run it directly using npx:
npx pi-tail
This will spin up a local server and output a clickable link in your terminal:
[pi-tail] Visualizer running at http://localhost:3000
Custom Ports
If port 3000 is currently in use, pass the --port (or -p) flag to specify a different port:
npx pi-tail --port 4000
# or
npx pi-tail -p 8080
(Optional) If you prefer to install it globally for offline or frequent usage:
npm install -g pi-tail
pi-tail
Architecture Overview
bin/pi-tail.js: The CLI entrypoint that parses arguments using native Node.js utilities and boots the web server.server.js: Manages static asset delivery, exposes the/api/logsdirectory scanner, and handles connection-specificfs.watchfile-tailing via SSE.public/: Contains the client-side single-page dashboard.app.js: Main controller handling SSE connections, DOM lifecycle, and view toggling.trace_parser.js: Mechanism for reconstructing parent-child execution trees from chronological JSONL spans.ui.js: DOM generation logic, including the recursive tree builder, Gantt charts, and native modals.
License
MIT