
pi-usage-widget
v0.2.1
Published
Usage statistics footer widget for Pi sessions.
Maintainers
 cullendotdev
Readme
Pi Usage Widget
Live usage statistics — cost, tokens, cache — as a widget above the editor, plus a /usage dashboard.
Installation • Widget • Dashboard • Settings • Configuration
A Pi extension that shows your usage statistics as a live widget above the editor. The widget is fully themeable: toggle, reorder, and recolor any element. Includes a interactive /usage dashboard with insights.
Commands & shortcuts
| Command / shortcut | Action |
|---|---|
| /usage | Opens the interactive usage dashboard |
| /usage-settings | Opens the widget settings menu |
| Ctrl+Alt+U or /cycle-usage-mode | Cycle the widget display mode (enabled modes only) |
| Alt+U or /cycle-usage-scope | Cycle the widget time scope |
1. Installation
Pi package manager
pi install npm:pi-usage-widgetManual (local development)
Clone or copy the extension into your Pi extensions directory:
git clone https://github.com/cullendotdev/pi-usage-widget.git
cp -r pi-usage-widget ~/.pi/agent/extensions/pi-usage-widget
2. Usage Widget
A live widget appears above the editor whenever Pi is running. It gives at-a-glance cost tracking without interrupting your workflow. Every visual element (titles, column headers, totals rows, separator lines) can be hidden, reordered, or recolored independently.
Display modes
Press Ctrl+Alt+U to cycle through enabled display modes. Each mode answers a different question about your usage:
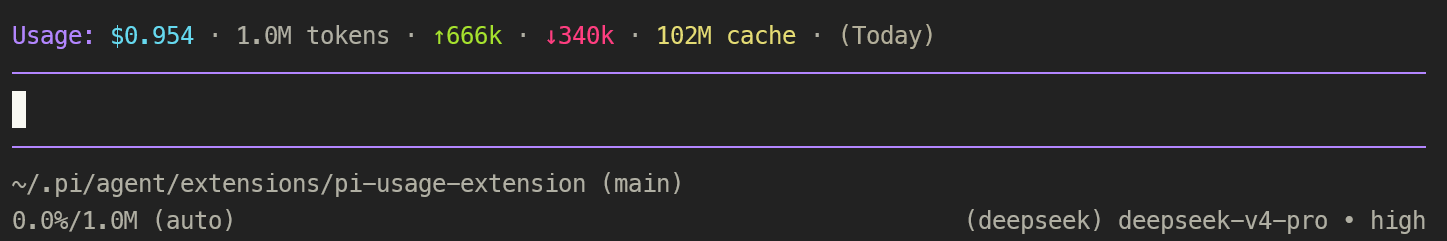
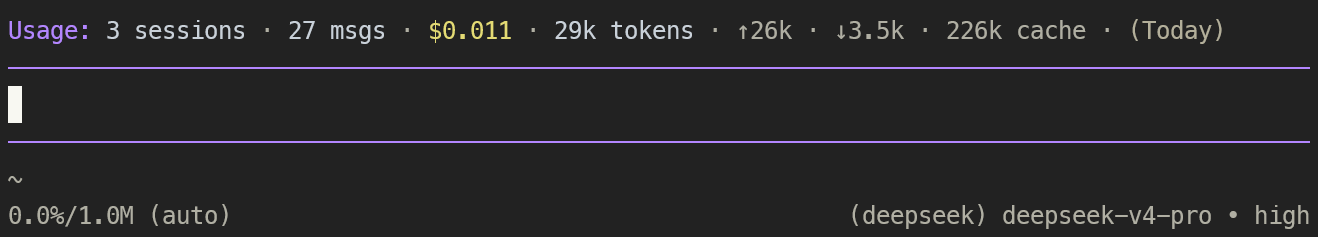
Summary — single-line total cost for the active time scope.
Per Provider — per-provider breakdown. (Internal name:
compact.)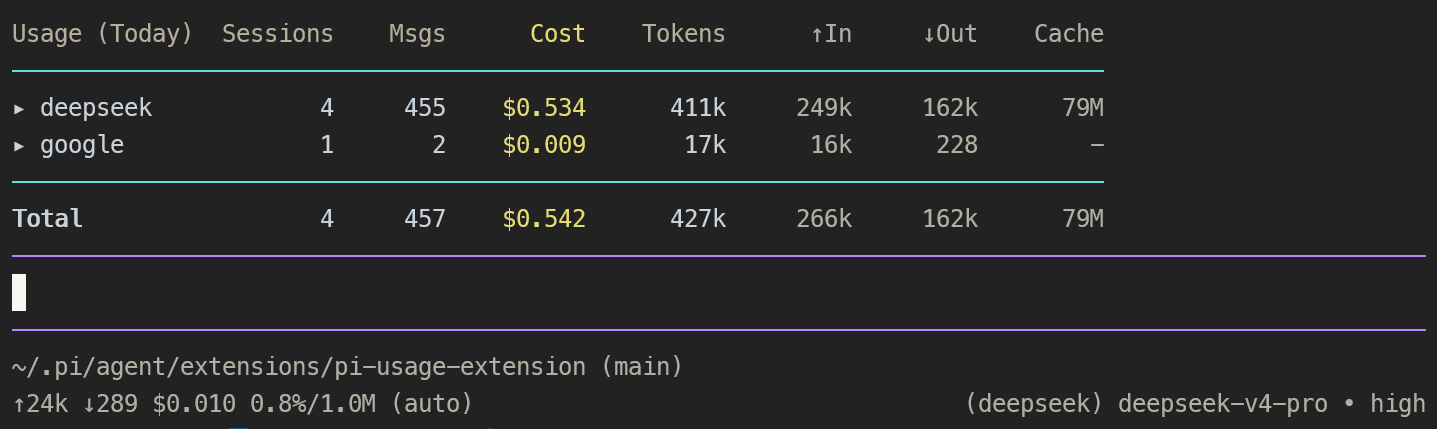
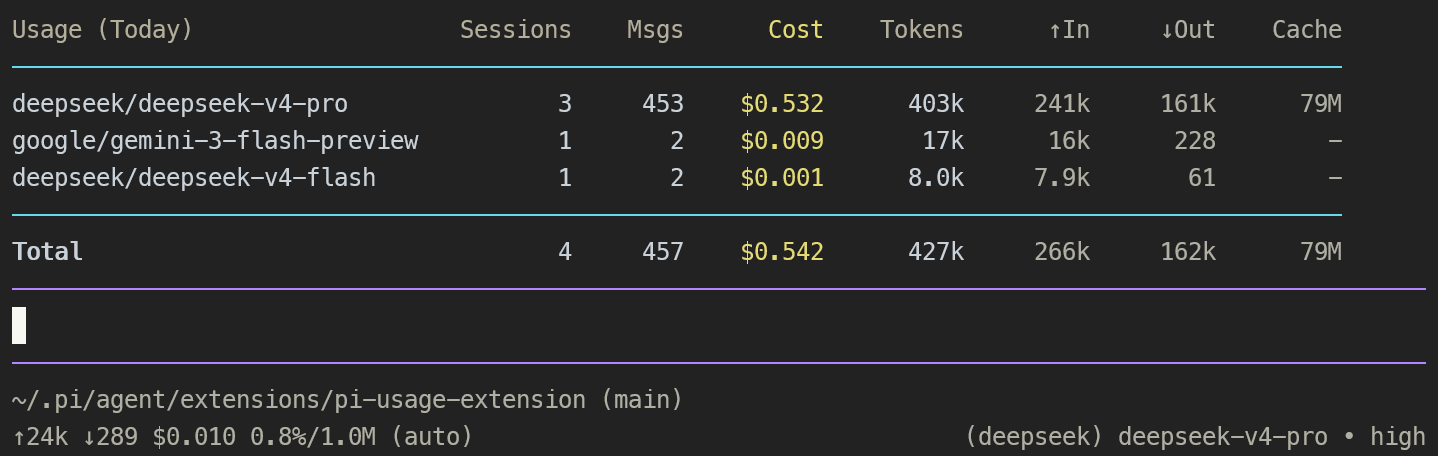
Per Model — full table with one row per model, no provider grouping. (provider name can be hidden)
Provider & Model — full table with models nested under each provider. (Internal name:
expanded.)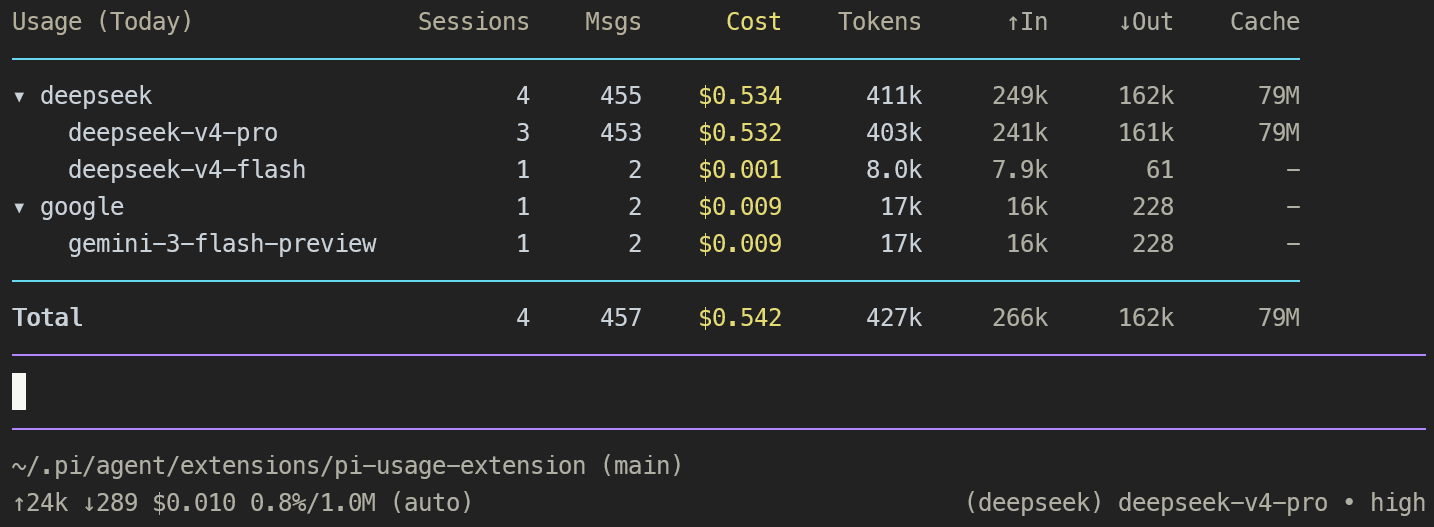
Hidden — the widget is suppressed. Press
Ctrl+Alt+Uto bring it back.
Time scopes
Press Alt+U to cycle through scopes:
| Period | Definition | |---|---| | Last Hour | Rolling 60-minute window from now | | Today | From 00:00 UTC today | | Yesterday | Previous UTC calendar day | | This Week | From Monday 00:00 UTC of the current week | | Last Week | Previous week (Monday 00:00 UTC → this Monday 00:00 UTC) | | This Month | From the 1st of the current month (UTC) | | All Time | All recorded sessions |
Periods are anchored to UTC. Session timestamps are recorded as absolute milliseconds, so the boundaries shift uniformly regardless of where the data was created.
Columns
| Column | Description |
|---|---|
| Provider / Model | Provider name; expandable to show models in nested modes |
| Sessions | Number of unique sessions |
| Msgs | Number of assistant messages |
| Cost | Total cost in USD (from the API response) |
| Tokens | Fresh tokens for the turn: input + output + cacheWrite |
| ↑In | Fresh input tokens: input + cacheWrite (dimmed) |
| ↓Out | Output tokens (dimmed) |
| Cache | cacheRead + cacheWrite (dimmed; informational) |
Tokensand↑Inintentionally excludecacheRead. Repeated cache hits don't swell the dashboard totals — those numbers reflect the fresh / billed prompt work.
Refresh behaviour
The widget updates automatically:
- Debounced — within ~1 second after each assistant message completes.
- Periodic — every 30 seconds, so activity from subagents or other Pi sessions is captured too.
3. Usage Dashboard (/usage)
/usage opens an interactive dashboard with a live widget plus a settings entry point. It is the easiest way to drill into the numbers behind the summary line.
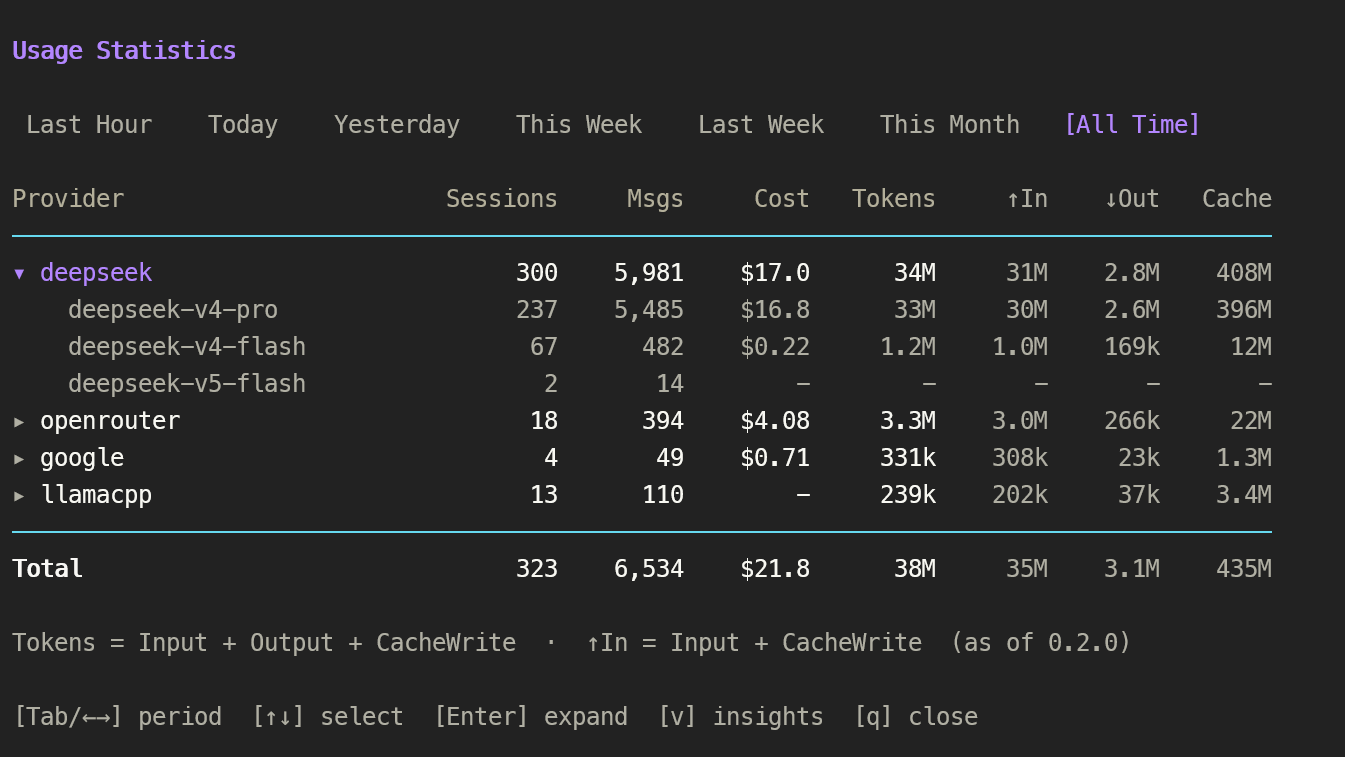
View modes
Press v to toggle between two views:
- Table (default) — per-provider / per-model stats with cost and token breakdown.
- Insights — narrative characteristics of your cost for the active period.
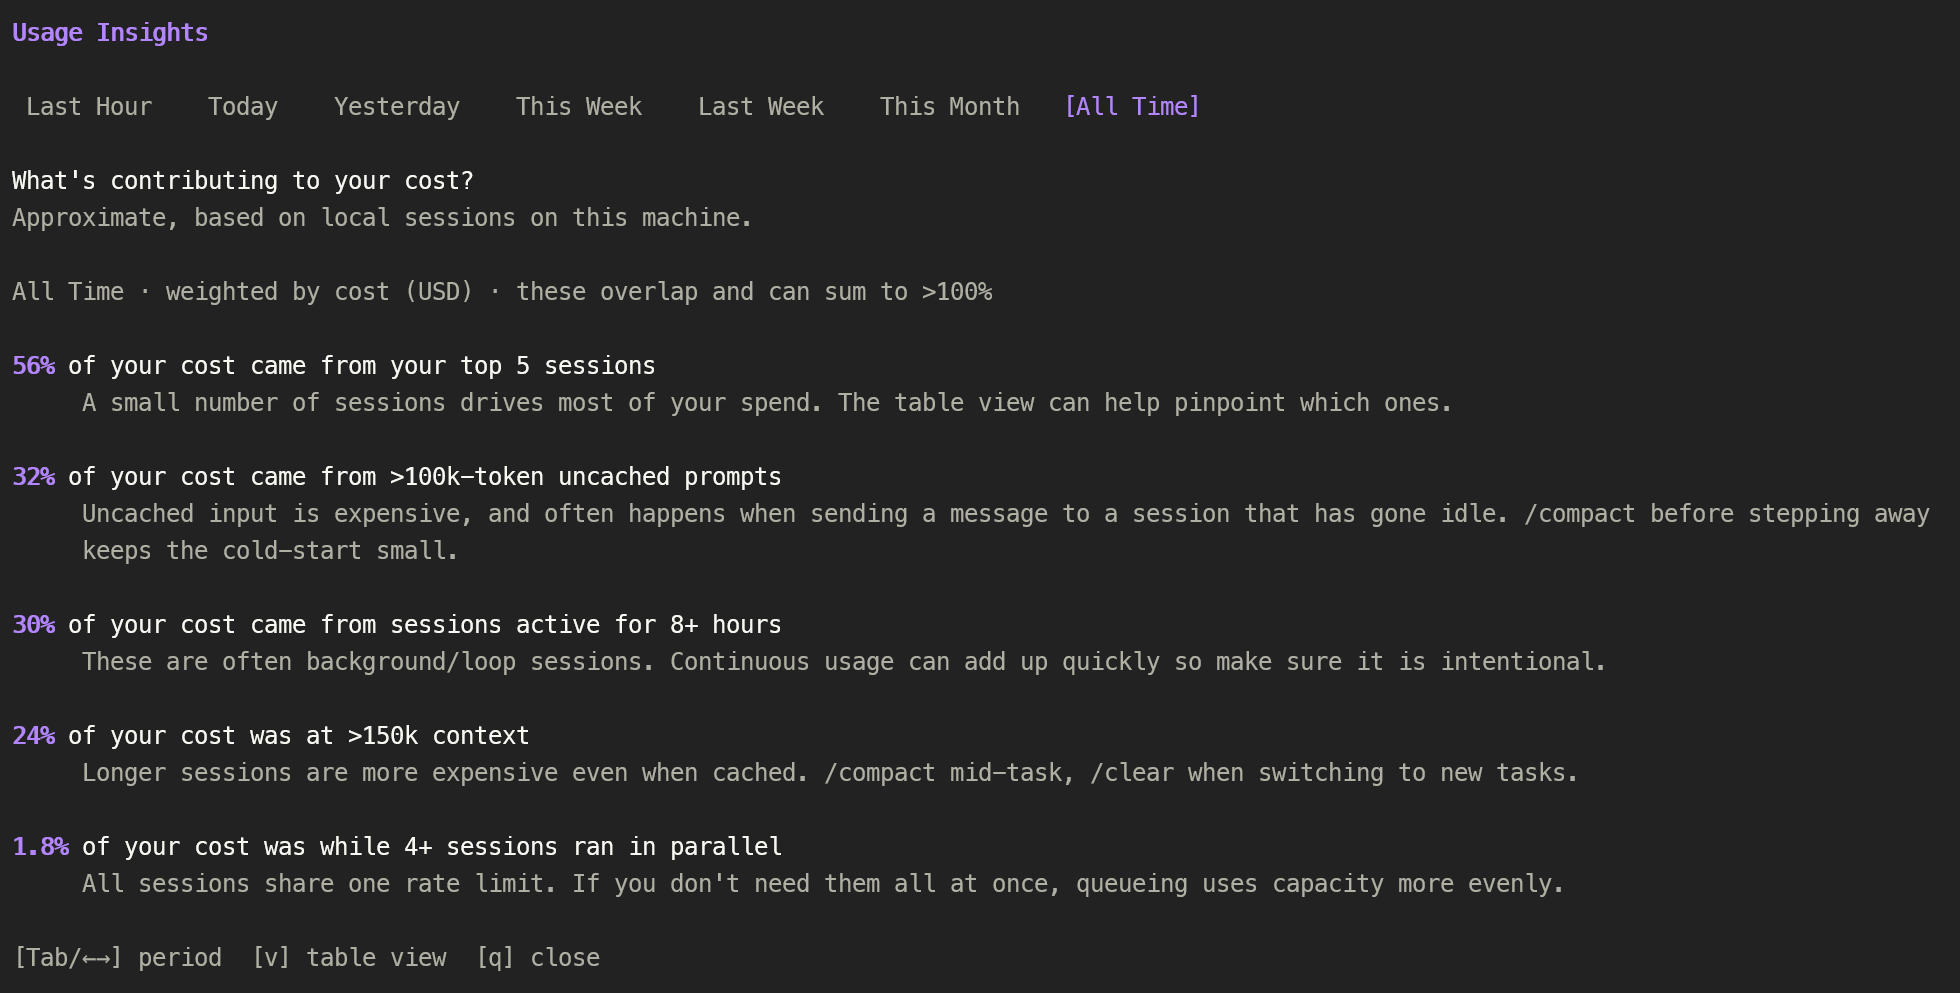
Insights are always weighted by recorded API cost (USD). Periods with no recorded cost show an explicit empty state rather than silently switching to a different unit.
Insight thresholds
| Insight | Threshold |
|---|---|
| Parallel sessions | ≥ 4 sessions active within an exact ±2 min window |
| Large context | input + cacheRead + cacheWrite > 150k |
| Large uncached prompt | input + cacheWrite > 100k |
| Long-running sessions | Session lifetime ≥ 8 hours (global, not per-period slice) |
| Top-session concentration | Top 5 sessions by cost |
Insights are independent characteristics, not a breakdown — they can overlap and sum to more than 100%.
4. Settings (/usage-settings)
Run /usage-settings to open the interactive settings menu. It has tabs for Global and each display mode, with a live preview pane that reflects changes instantly.
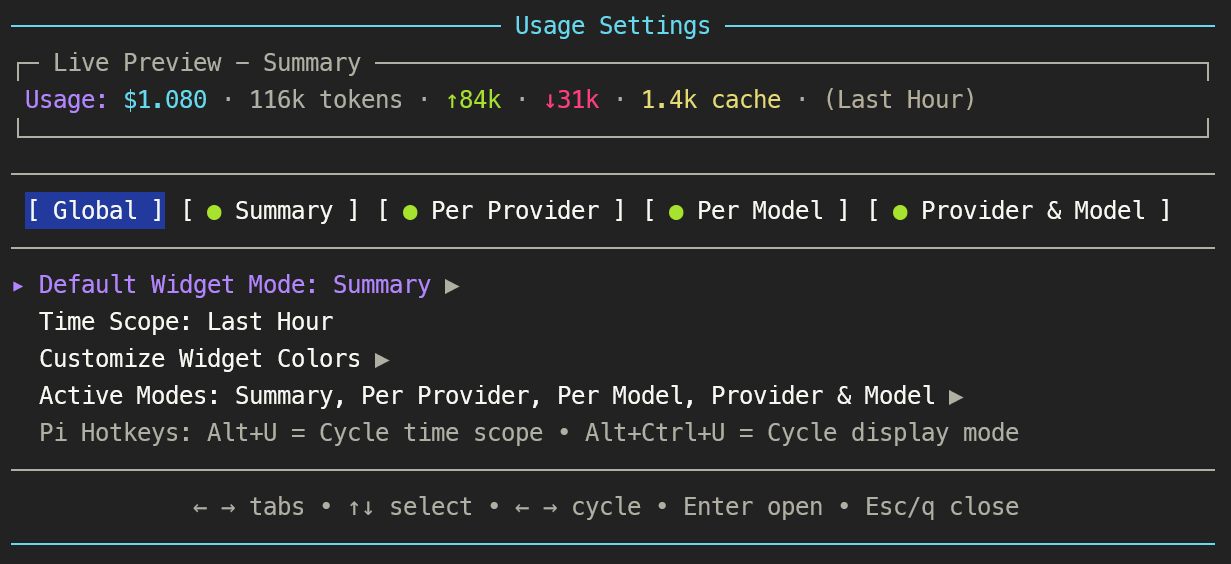
Default display mode & time scope
Set the defaults Pi uses when a session starts.
Colour customisation
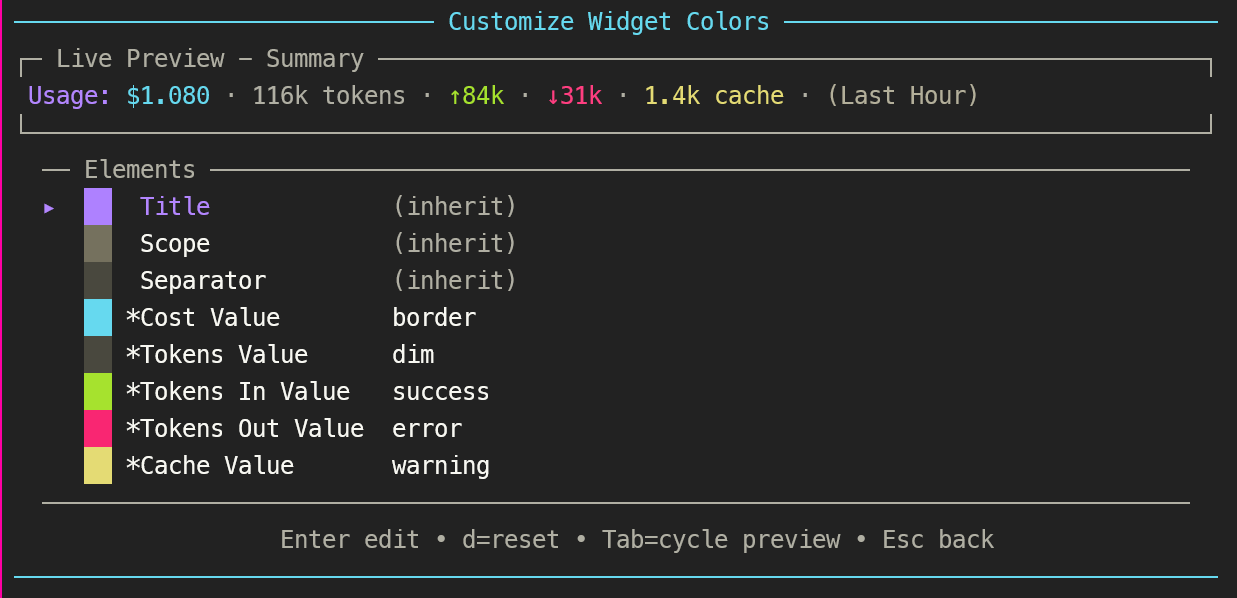
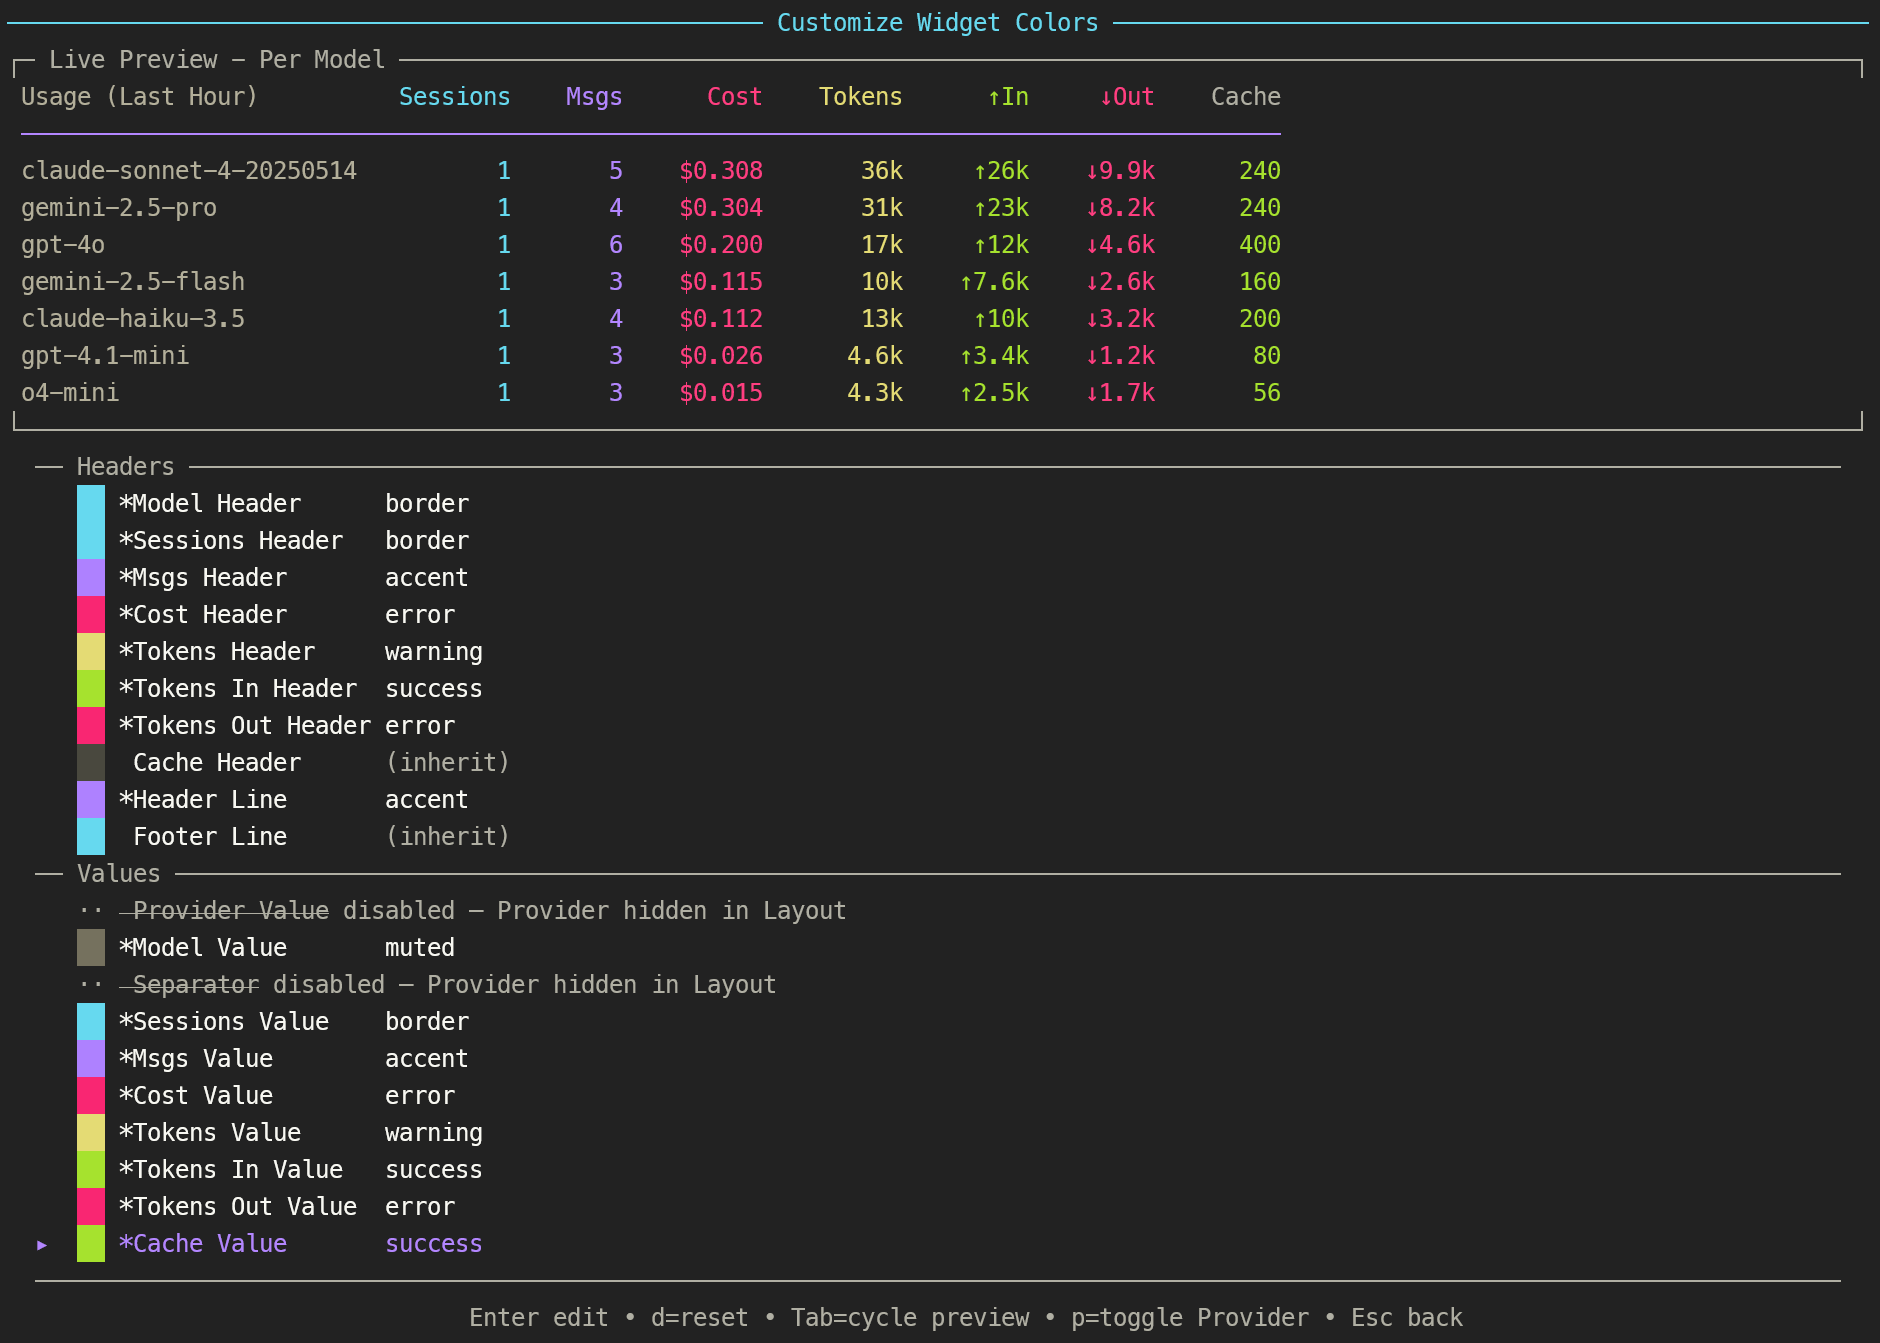
Navigate to Customize Widget Colors to open a flat, section-based list organised into:
- Headers — Title, Scope, and all column header colours.
- Values — all column value colours.
- Display — Header line, Footer line, Separator, and Total label.
Summary mode:
Per Model mode:
Three colour sources are available:
- Theme roles — pick from your live Pi theme fg roles (accent, muted, dim, text, border, warning, etc.). Swatches show your actual theme colours in real time.
- ANSI palette — pick from the terminal's 16-colour palette. Terminal-native background escapes render each swatch accurately. The palette is queried from your terminal via OSC 4 on startup, falling back to reasonable hex approximations.
- Custom hex — enter any
#rrggbbcolour.
While editing a colour, a live preview shows your widget with the change applied and the active element underlined. Press Tab to cycle through which display modes are previewed.
Overrides are per-mode: each display mode has its own override map, and setting an override to null lets it inherit from the live Pi theme.
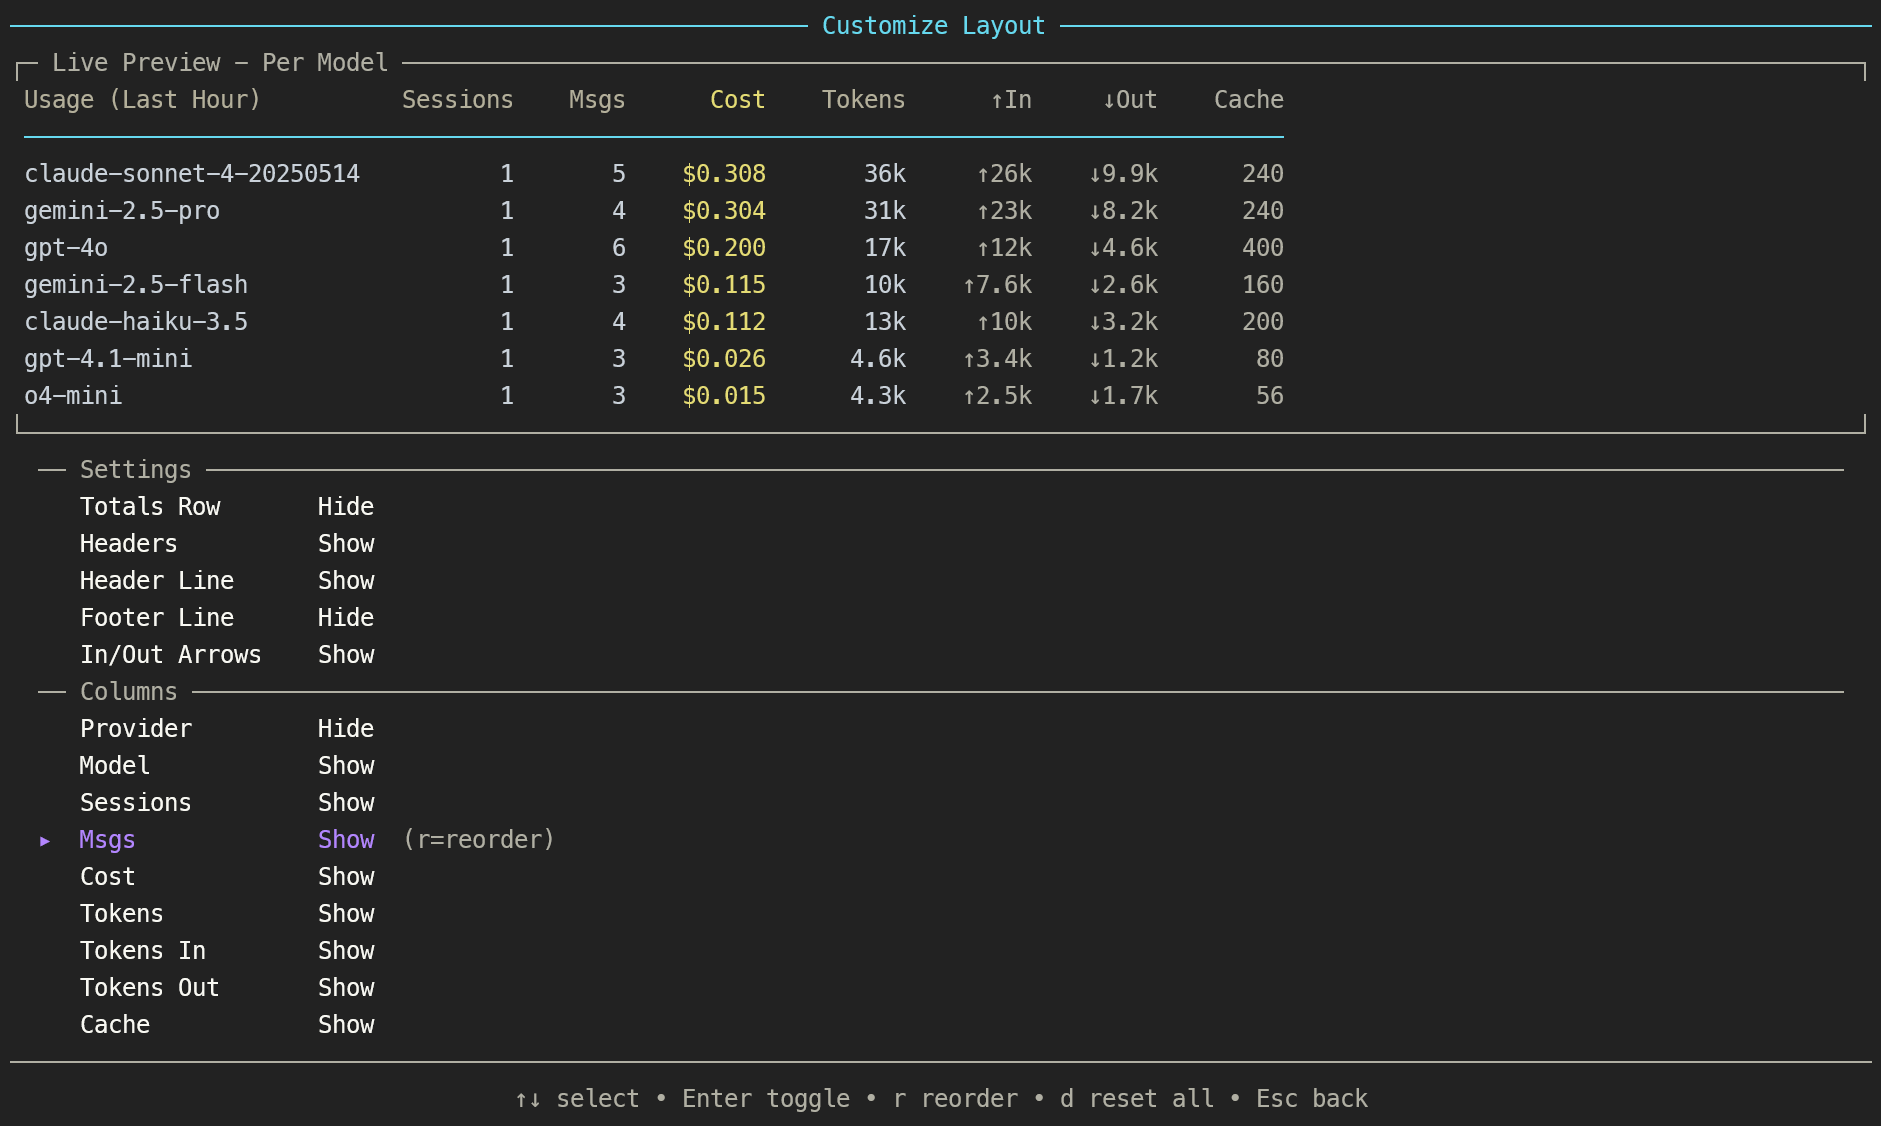
Layout customisation
Per-mode layout is split into two sections:
- Settings — toggles for Totals Row, Headers, Header Line, and Footer Line.
- Columns — toggle visibility for each data column. Press
ron any column to enter reorder mode: use↑/↓to move it,Enterto confirm,Escto cancel. The live preview updates as you reorder.
Column visibility and order are per-mode — Summary can have a different layout than Provider & Model.
Enable / disable modes
Toggle which display modes appear in the Ctrl+Alt+U cycle. The widget only cycles through enabled modes.
5. Colour System
The widget's colour resolution works in layers:
Per-mode overrides → Live Pi theme (DEFAULT_THEME_ROLE_MAP) → Hardcoded fallback hexEach widget element maps to a Pi theme fg role by default:
| Element | Theme role | Element | Theme role |
|---|---|---|---|
| Title | accent | Provider value | text |
| Scope | muted | Model value | text |
| Column headers | muted | Sessions / Token values | text |
| Cost header | warning | Cost value | warning |
| Cache / In / Out headers | dim | Cache / In / Out values | dim |
| Separator lines | border | Separator · | dim |
| Total label | text | | |
The widget naturally adapts to any Pi theme — it does not need a separate theme selection.
6. Configuration & Data
Settings menu
All configuration is done via the interactive settings menu. /usage-settings
Settings file
Settings persist in ~/.pi/agent/config/pi-usage-widget-settings.json (auto-migrated from the legacy ~/.pi/agent/pi-usage-widget-settings.json location on first load). Override the path with the PI_USAGE_CONFIG_PATH environment variable. The file uses deep merging: only keys you change are written, and defaults fill in the rest.
Data source
Statistics are parsed recursively from session files in ~/.pi/agent/sessions/, including nested subagent runs such as run-0/ directories. Each session is a JSONL file containing message entries with usage data. All statistics are read and used locally; nothing is uploaded.
Assistant messages duplicated across branched session files are deduplicated by timestamp + total tokens, while recursive subagent sessions are still included.
Respects the PI_CODING_AGENT_DIR environment variable when set.
Provider notes
- Cost tracking — cost data comes directly from the API response (
usage.cost.total). Accuracy depends on the provider reporting costs. - Cache tokens — cache token support varies by provider. The "Cache" column combines both read and write tokens.
Tokensand↑Ininclude cache writes but exclude cache reads so totals reflect fresh / billed prompt work.
Credits
Credit to @tmustier for their original work on pi-usage-extension, which served as the starting point for this extension.