
playwright-smart-reporter
v1.6.5
Published
An intelligent Playwright HTML reporter with AI-powered failure analysis, flakiness detection, and performance regression alerts
Maintainers
 qa.gary.parker
Readme
playwright-smart-reporter
An intelligent Playwright HTML reporter with AI-powered failure analysis, flakiness detection, performance regression alerts, and a modern interactive dashboard. Free + Starter + Pro tiers — same npm package, paid features unlock with a license key.
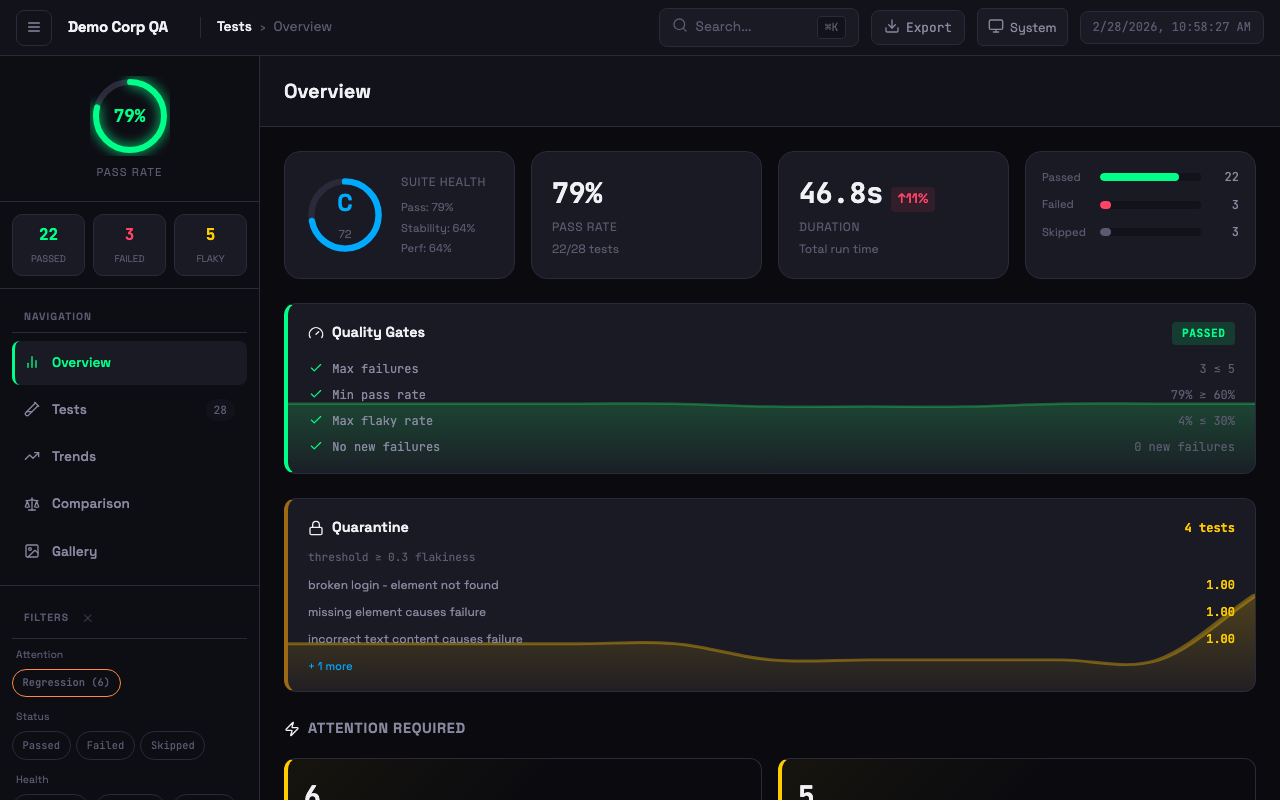 Dashboard with quality gates, quarantine, suite health grade, attention alerts, and failure clusters
Installation
npm install -D playwright-smart-reporterQuick Start
Add to your playwright.config.ts:
import { defineConfig } from '@playwright/test';

export default defineConfig({
  reporter: [
    ['playwright-smart-reporter', {
      outputFile: 'smart-report.html',
      historyFile: 'test-history.json',
      maxHistoryRuns: 10,
    }],
  ],
});
Run your tests and open the generated smart-report.html.
Free vs Paid
The free tier includes everything you need for local test reporting. Paid plans add AI failure analysis, premium themes, PDF exports, quality gates, and more — activated with a license key.
| Feature | Local (Free) | Starter (£5/mo) | Pro (£9/mo) | |---|:---:|:---:|:---:| | Stability grades (A–F) so you know which tests to trust | ✅ | ✅ | ✅ | | Flakiness detection across retries and history | ✅ | ✅ | ✅ | | Run-to-run comparison — catch regressions before they ship | ✅ | ✅ | ✅ | | Screenshot, video, and trace gallery for every failure | ✅ | ✅ | ✅ | | Network request logs to pinpoint API issues | ✅ | ✅ | ✅ | | CI auto-detection & notifications | ✅ | ✅ | ✅ | | Live progress dashboard — watch results as tests execute | ✅ | ✅ | ✅ | | 4 built-in themes to match your workflow | ✅ | ✅ | ✅ | | Run, cancel, and filter tests from the live dashboard | | ✅ | ✅ | | AI-powered root cause analysis | | 2,000/mo | 5,000/mo | | 6 premium themes (Ocean, Sunset, Dracula, and more) | | ✅ | ✅ | | Share polished PDF reports with stakeholders | | ✅ | ✅ | | Export to JSON and JUnit XML for CI/CD pipelines | | ✅ | ✅ | | Quality gates — block merges when quality drops | | ✅ | ✅ | | Auto-quarantine unreliable tests to keep CI green | | ✅ | ✅ | | Brand reports with your logo and team name | | ✅ | ✅ | | Fully custom theme colours to match your brand | | | ✅ | | AI health summary — executive overview of suite quality | | ✅ | ✅ | | Priority email support — direct access to the team | | | ✅ |
Get a license at stagewright.dev
Activating a License
Set your license key via environment variable or config:
# Environment variable
export SMART_REPORTER_LICENSE_KEY=your-license-key
// Or in playwright.config.ts
reporter: [
['playwright-smart-reporter', {
outputFile: 'smart-report.html',
licenseKey: 'your-license-key',
}],
]Features
Core Analysis
- AI Failure Analysis — AI-powered fix suggestions via managed proxy — no API keys required
- Flakiness Detection — Historical tracking to identify unreliable tests (not single-run retries)
- Performance Regression Alerts — Warns when tests get significantly slower than average
- Stability Scoring — Composite health metrics (0-100 with grades A to F)
- Failure Clustering — Group similar failures by error type with error previews and AI analysis
- Test Retry Analysis — Track tests that frequently need retries
Interactive Dashboard
- Sidebar Navigation — Overview, Tests, Trends, Comparison, Gallery views
- Theme Support — 4 built-in themes (System, Light, Dark, High Contrast) with persistent preference
- Keyboard Shortcuts —
1-5switch views,j/knavigate tests,ffocus search,eexport summary - Virtual Scroll — Pagination for large test suites (500+ tests)
- Exportable Summary Card — One-click export of test run summary
Test Details
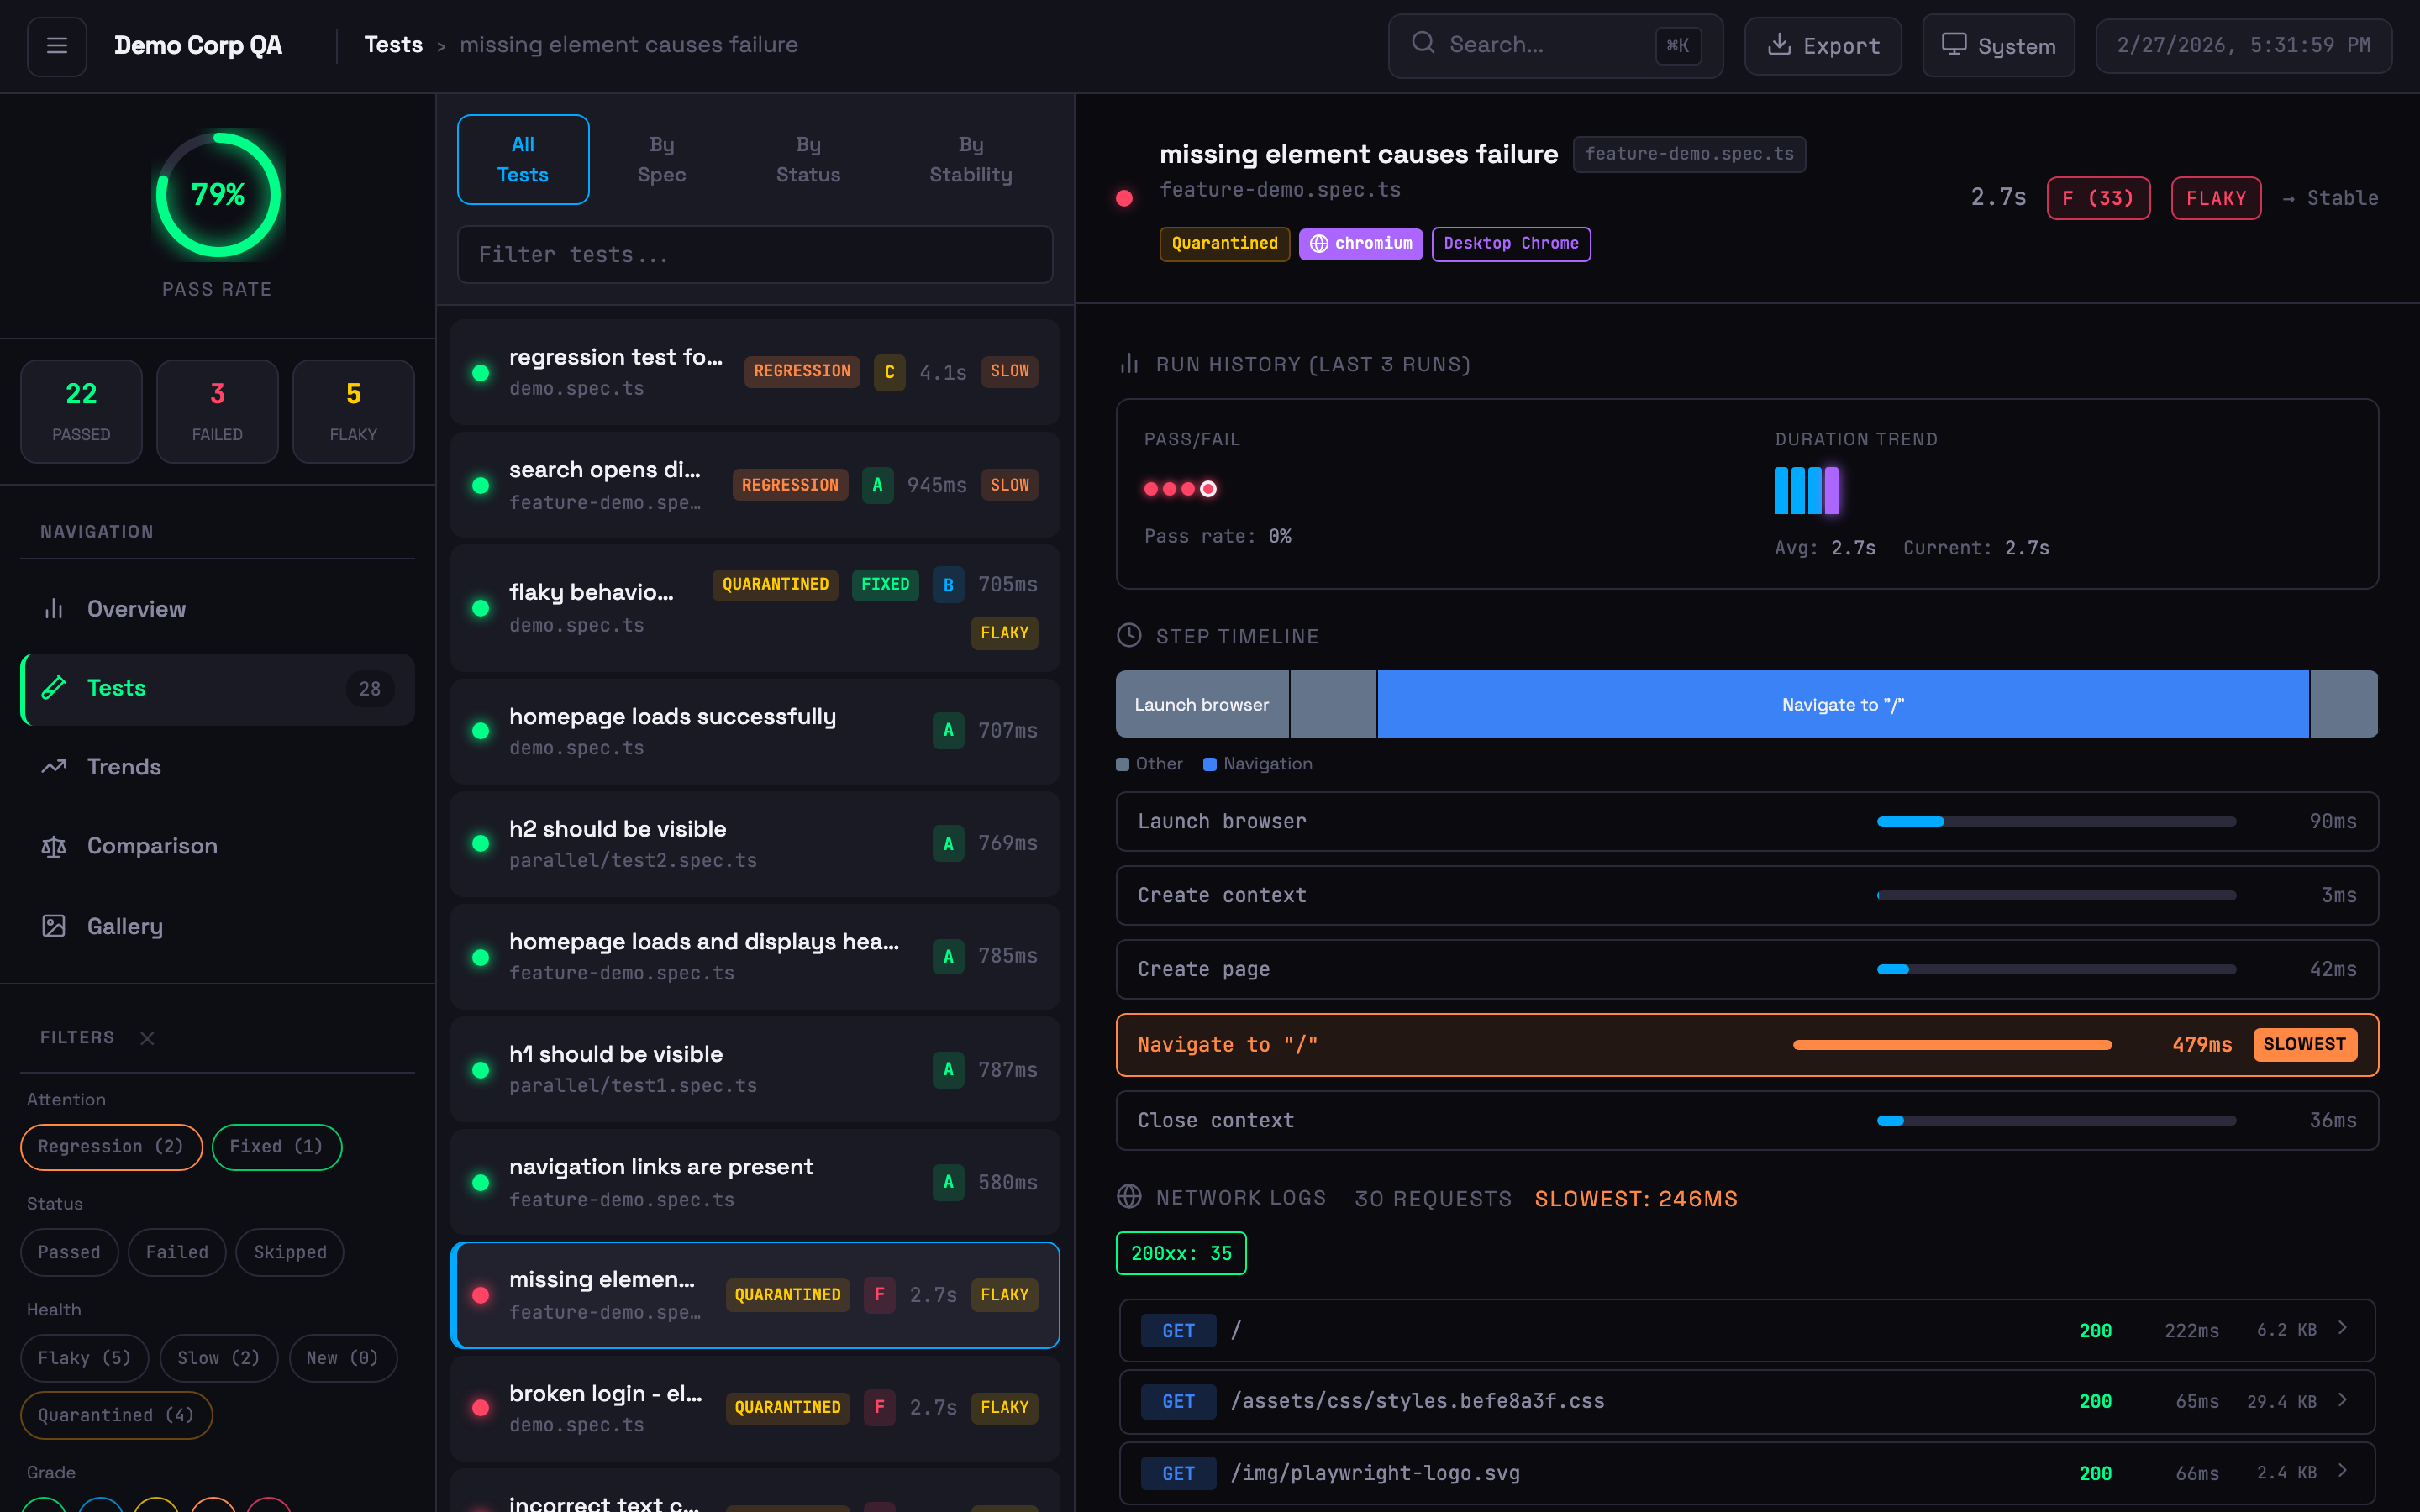 Expanded test card with step timeline, network logs, run history, and quarantine badge
- Step Timing Breakdown — Visual bars highlighting the slowest steps
- Flamechart Visualisation — Colour-coded timeline bars (navigation, assertion, action, API, wait)
- Network Logs — API calls with status codes, timing, and payload details (from trace files)
- Inline Trace Viewer — View traces directly in the dashboard
- Screenshot Embedding — Failure screenshots displayed inline
- Browser & Project Badges — Shows which browser/project each test ran against
- Annotation Support —
@slow,@fixme,@skip,@issue, custom annotations with styled badges
Trend Analytics
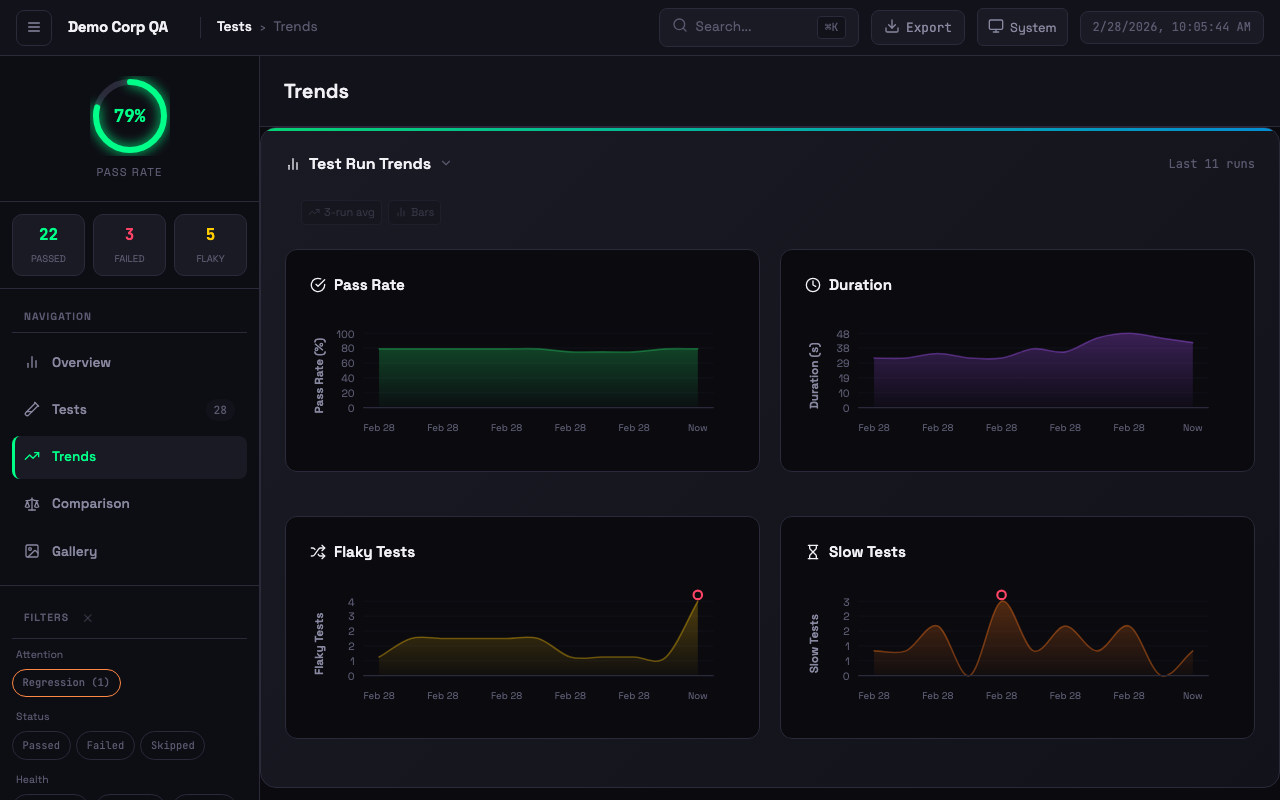 Interactive trend charts with pass rate, duration, flaky tests, and slow test tracking
- Moving Averages — Overlay on pass rate and duration trends
- Anomaly Detection — 2-sigma outlier detection with visual markers
- Clickable History — Click any chart bar to drill into that historical run
Artifact Gallery
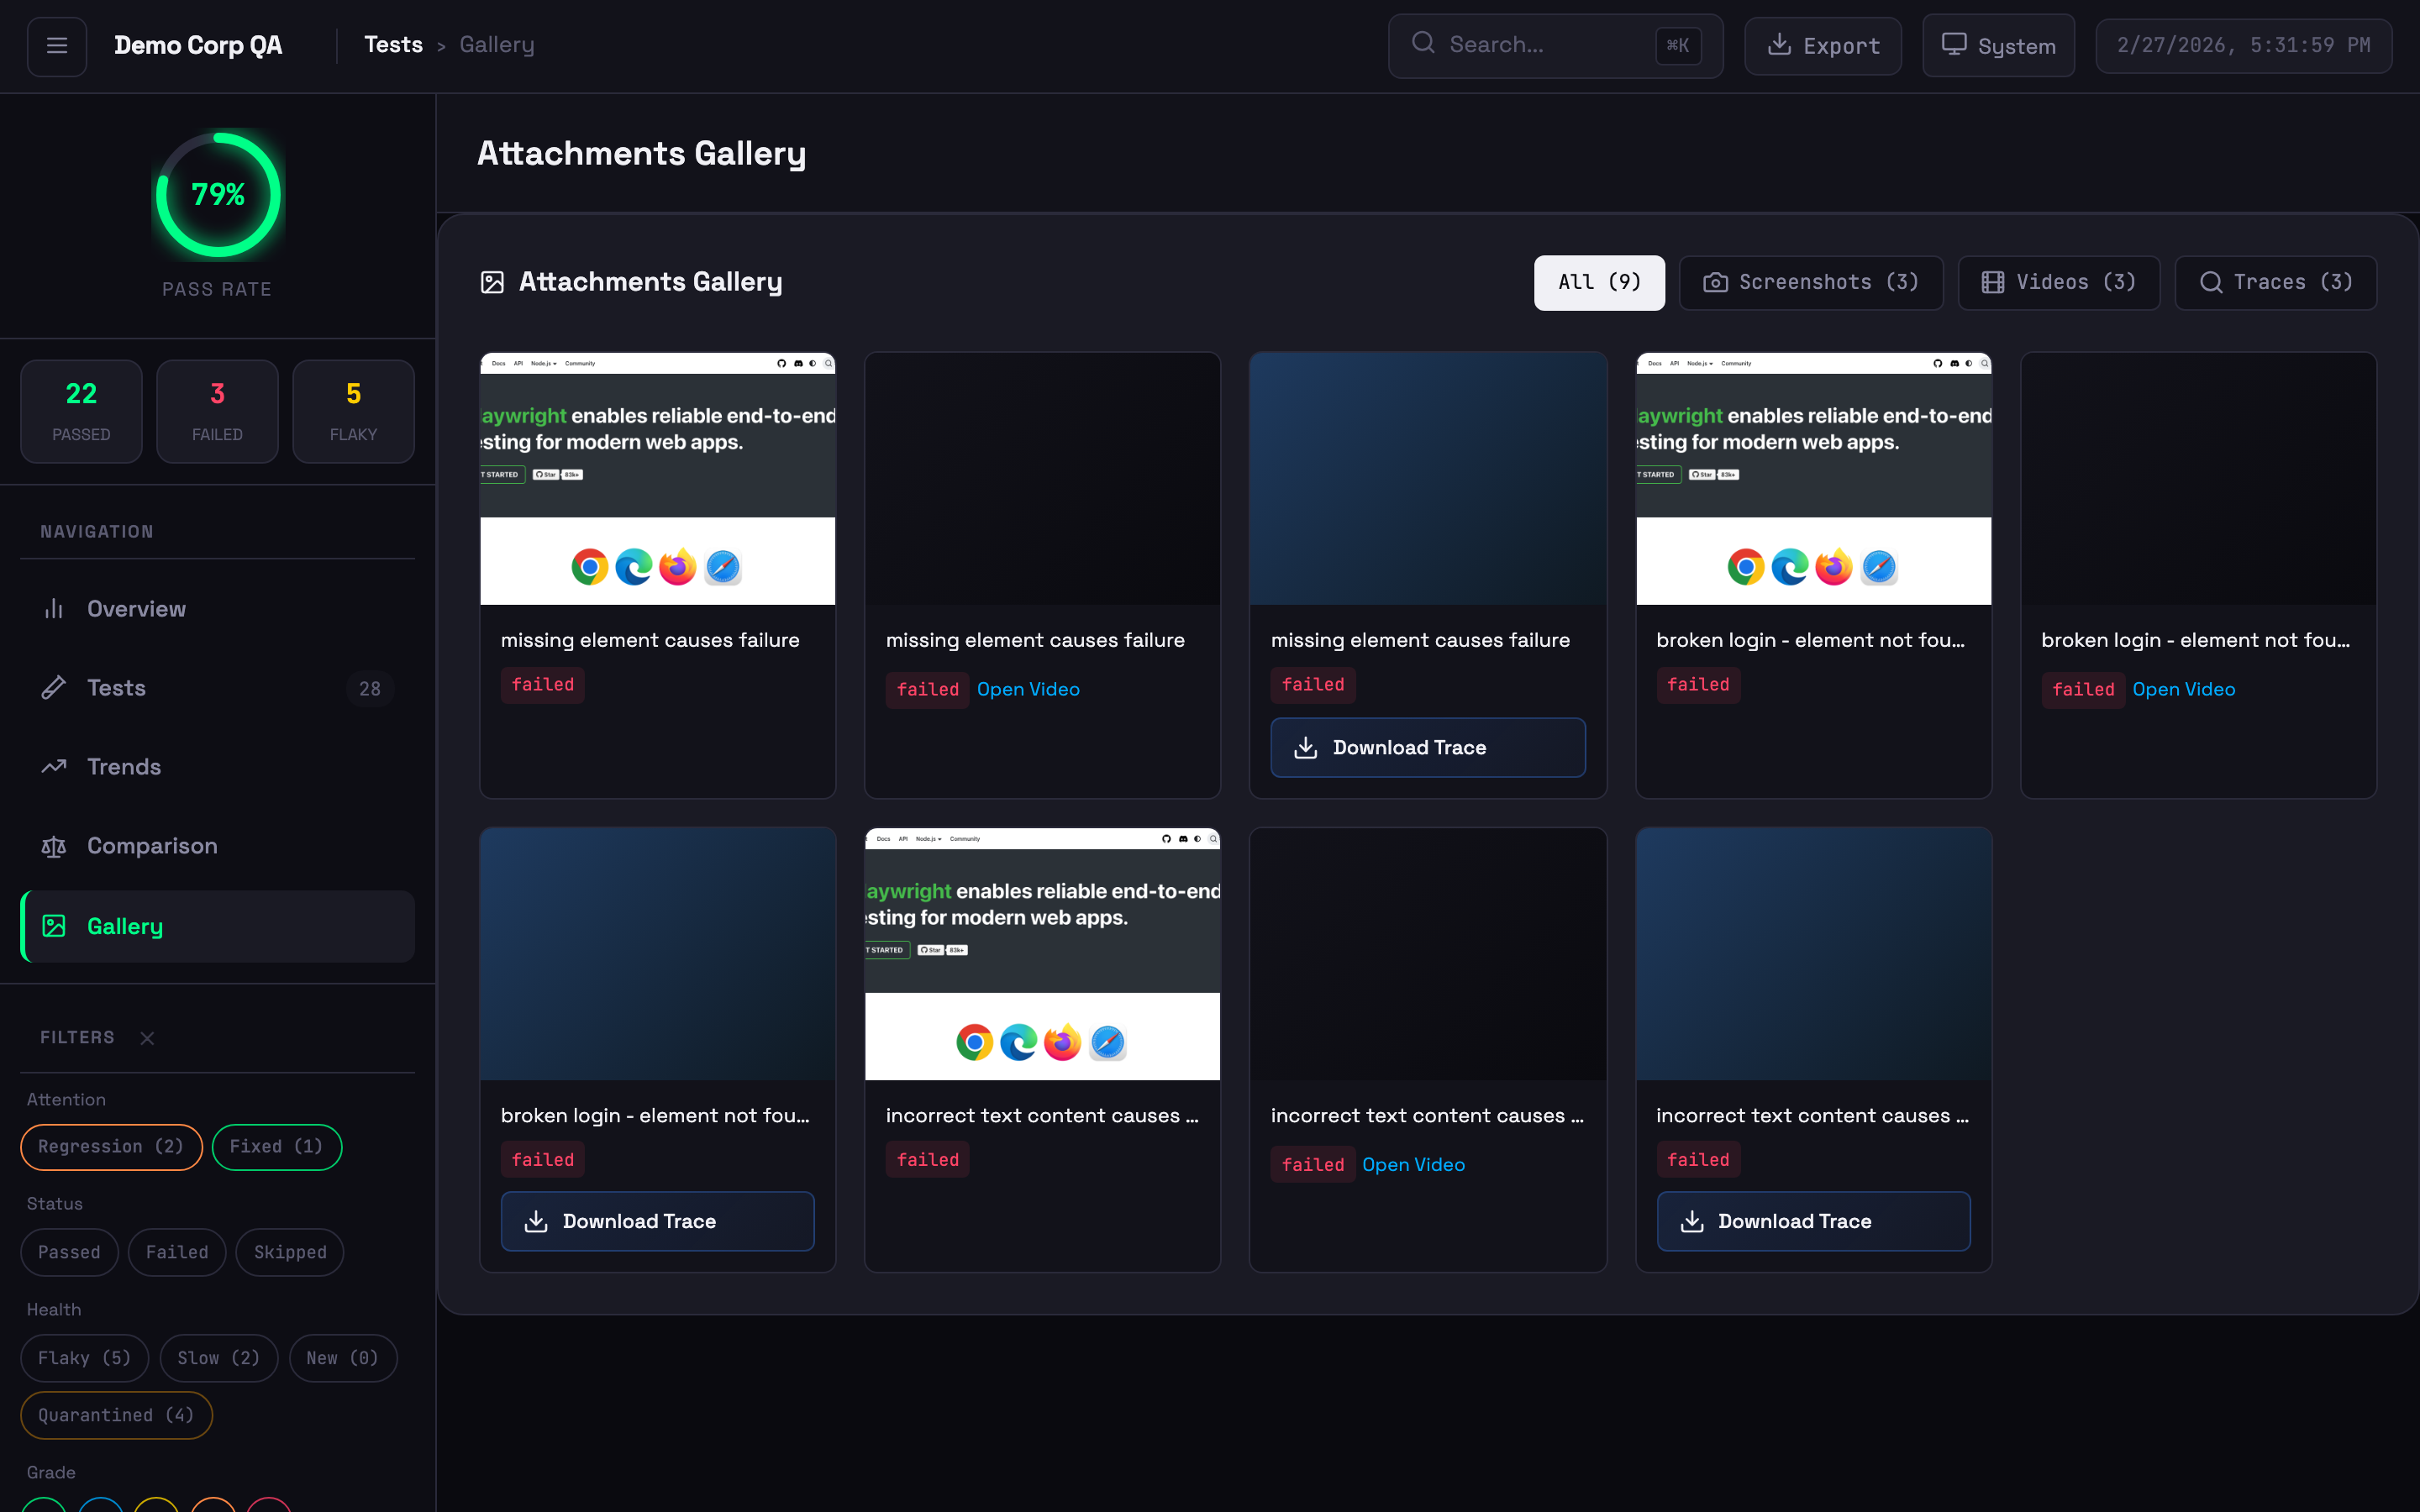 Visual grid of screenshots, videos, and trace files
Trace Viewer
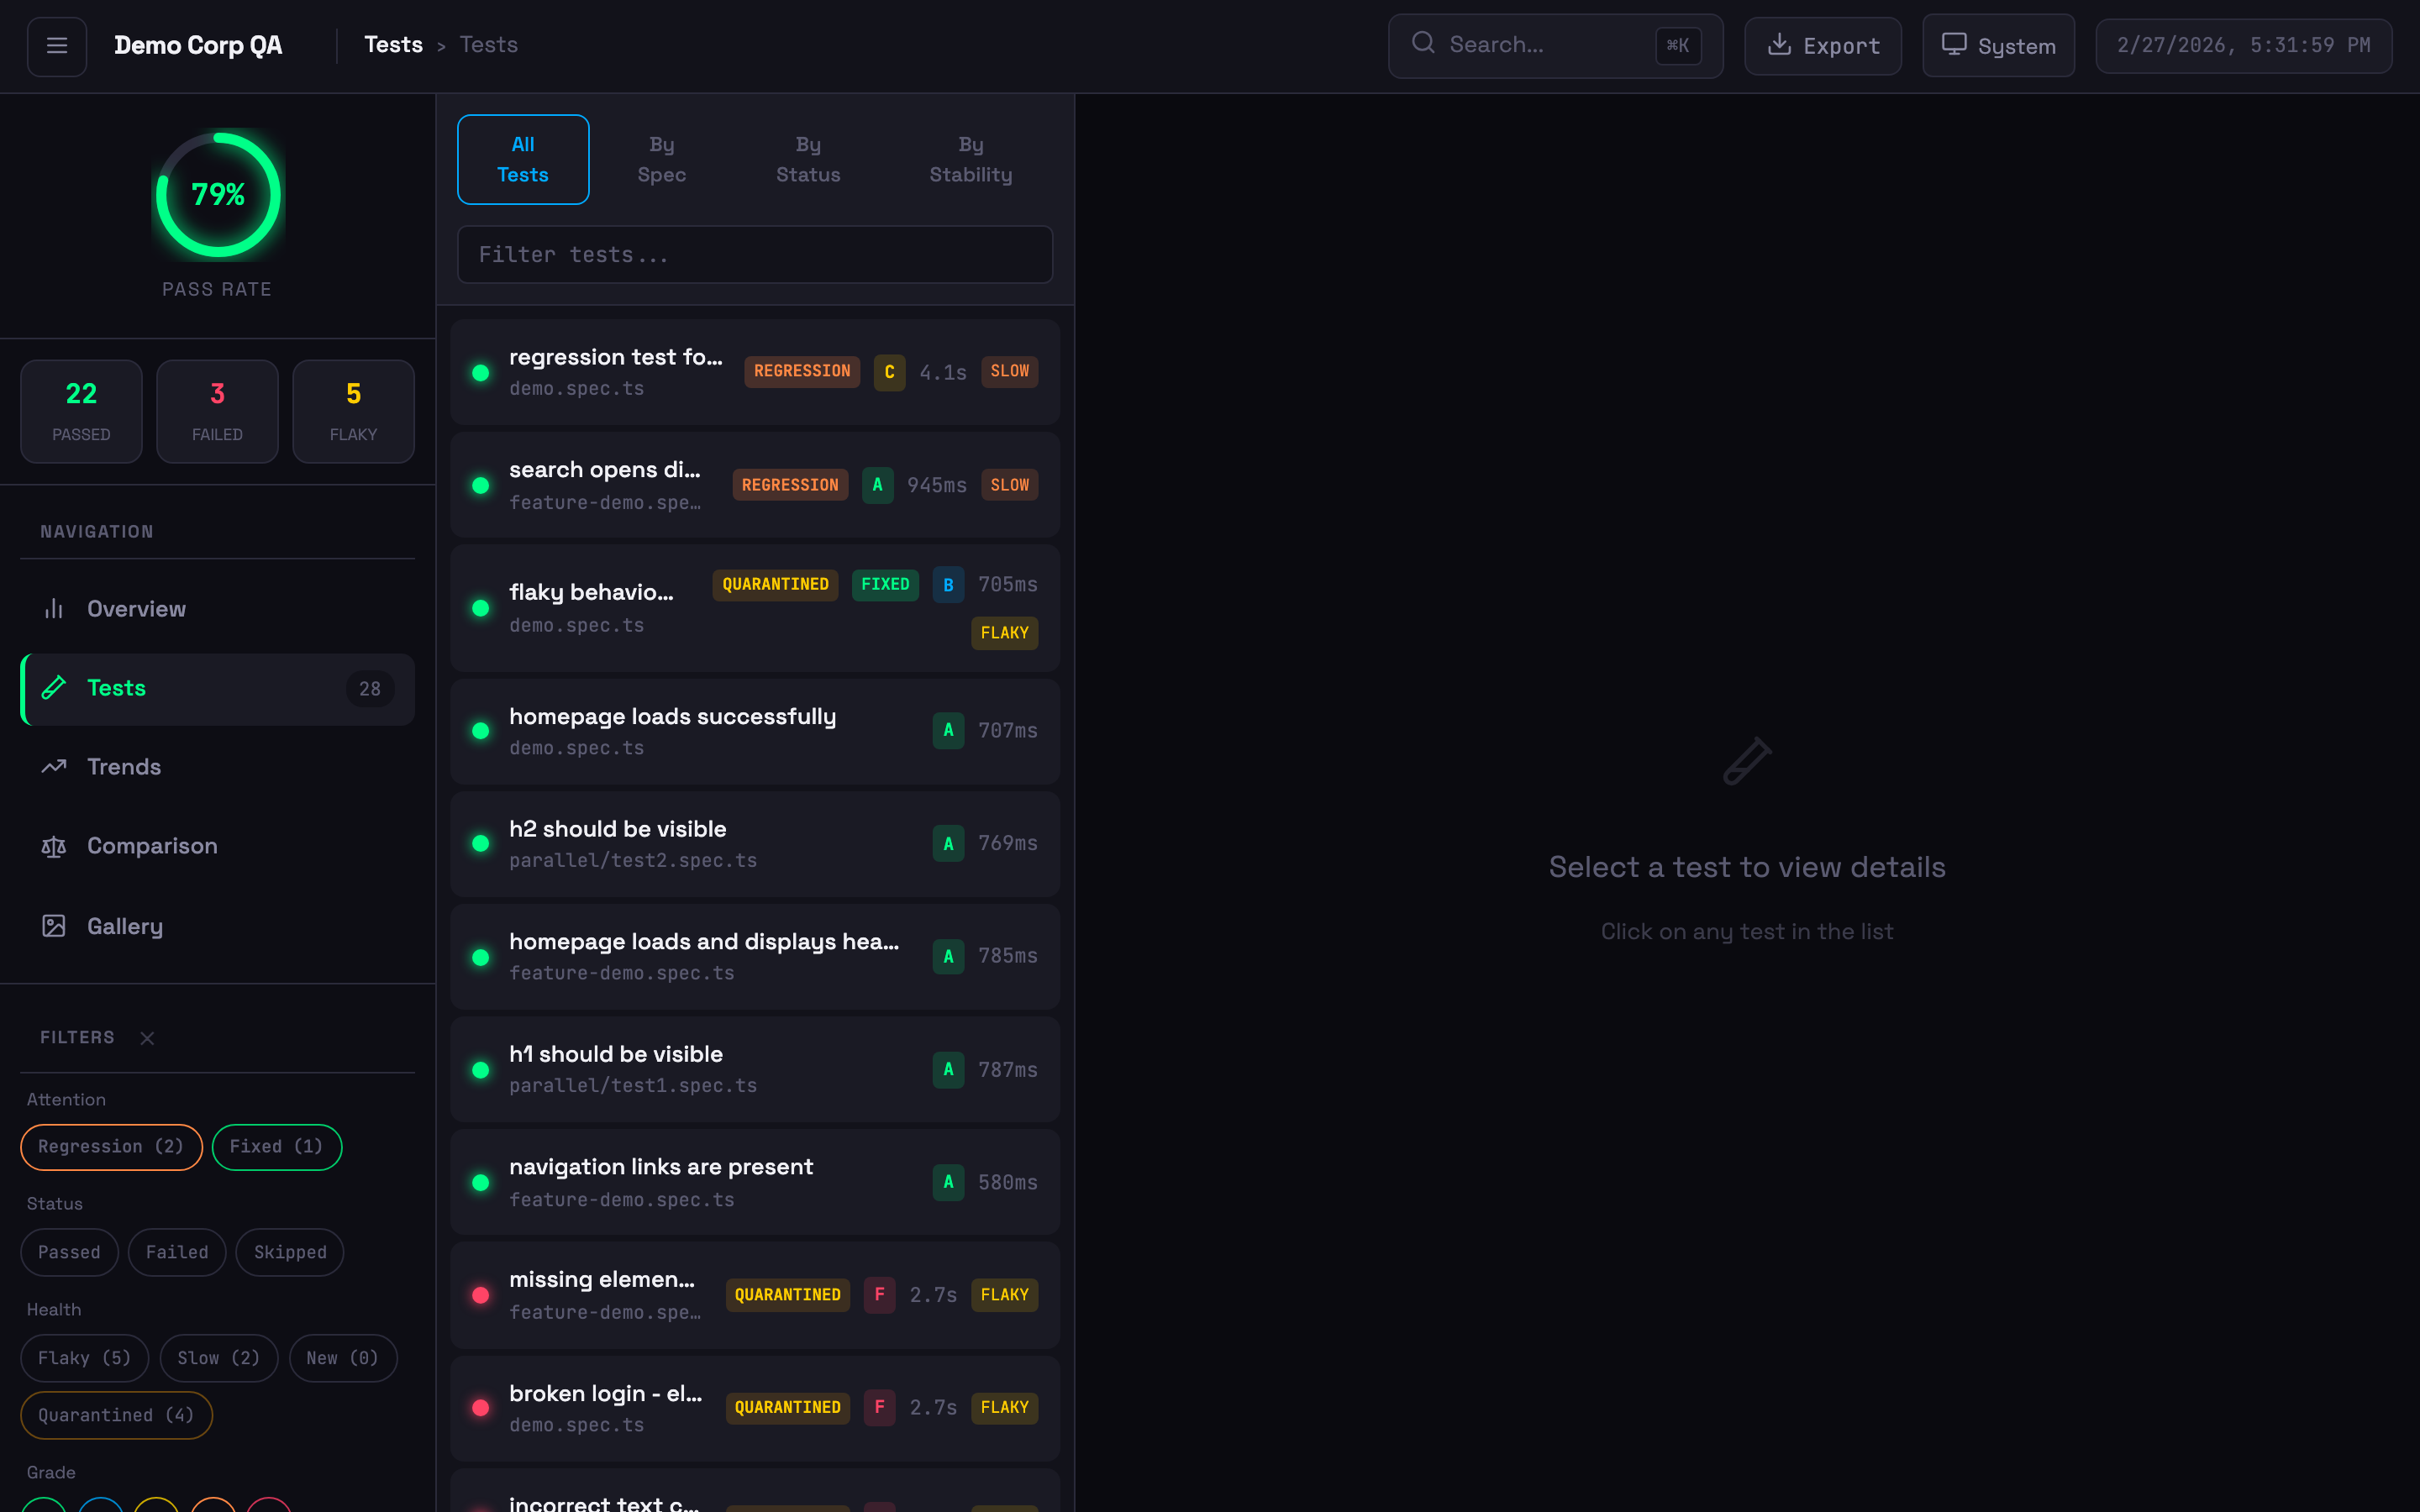 Test list with status badges, stability grades, quarantine indicators, and filtering
Flakiness Detection
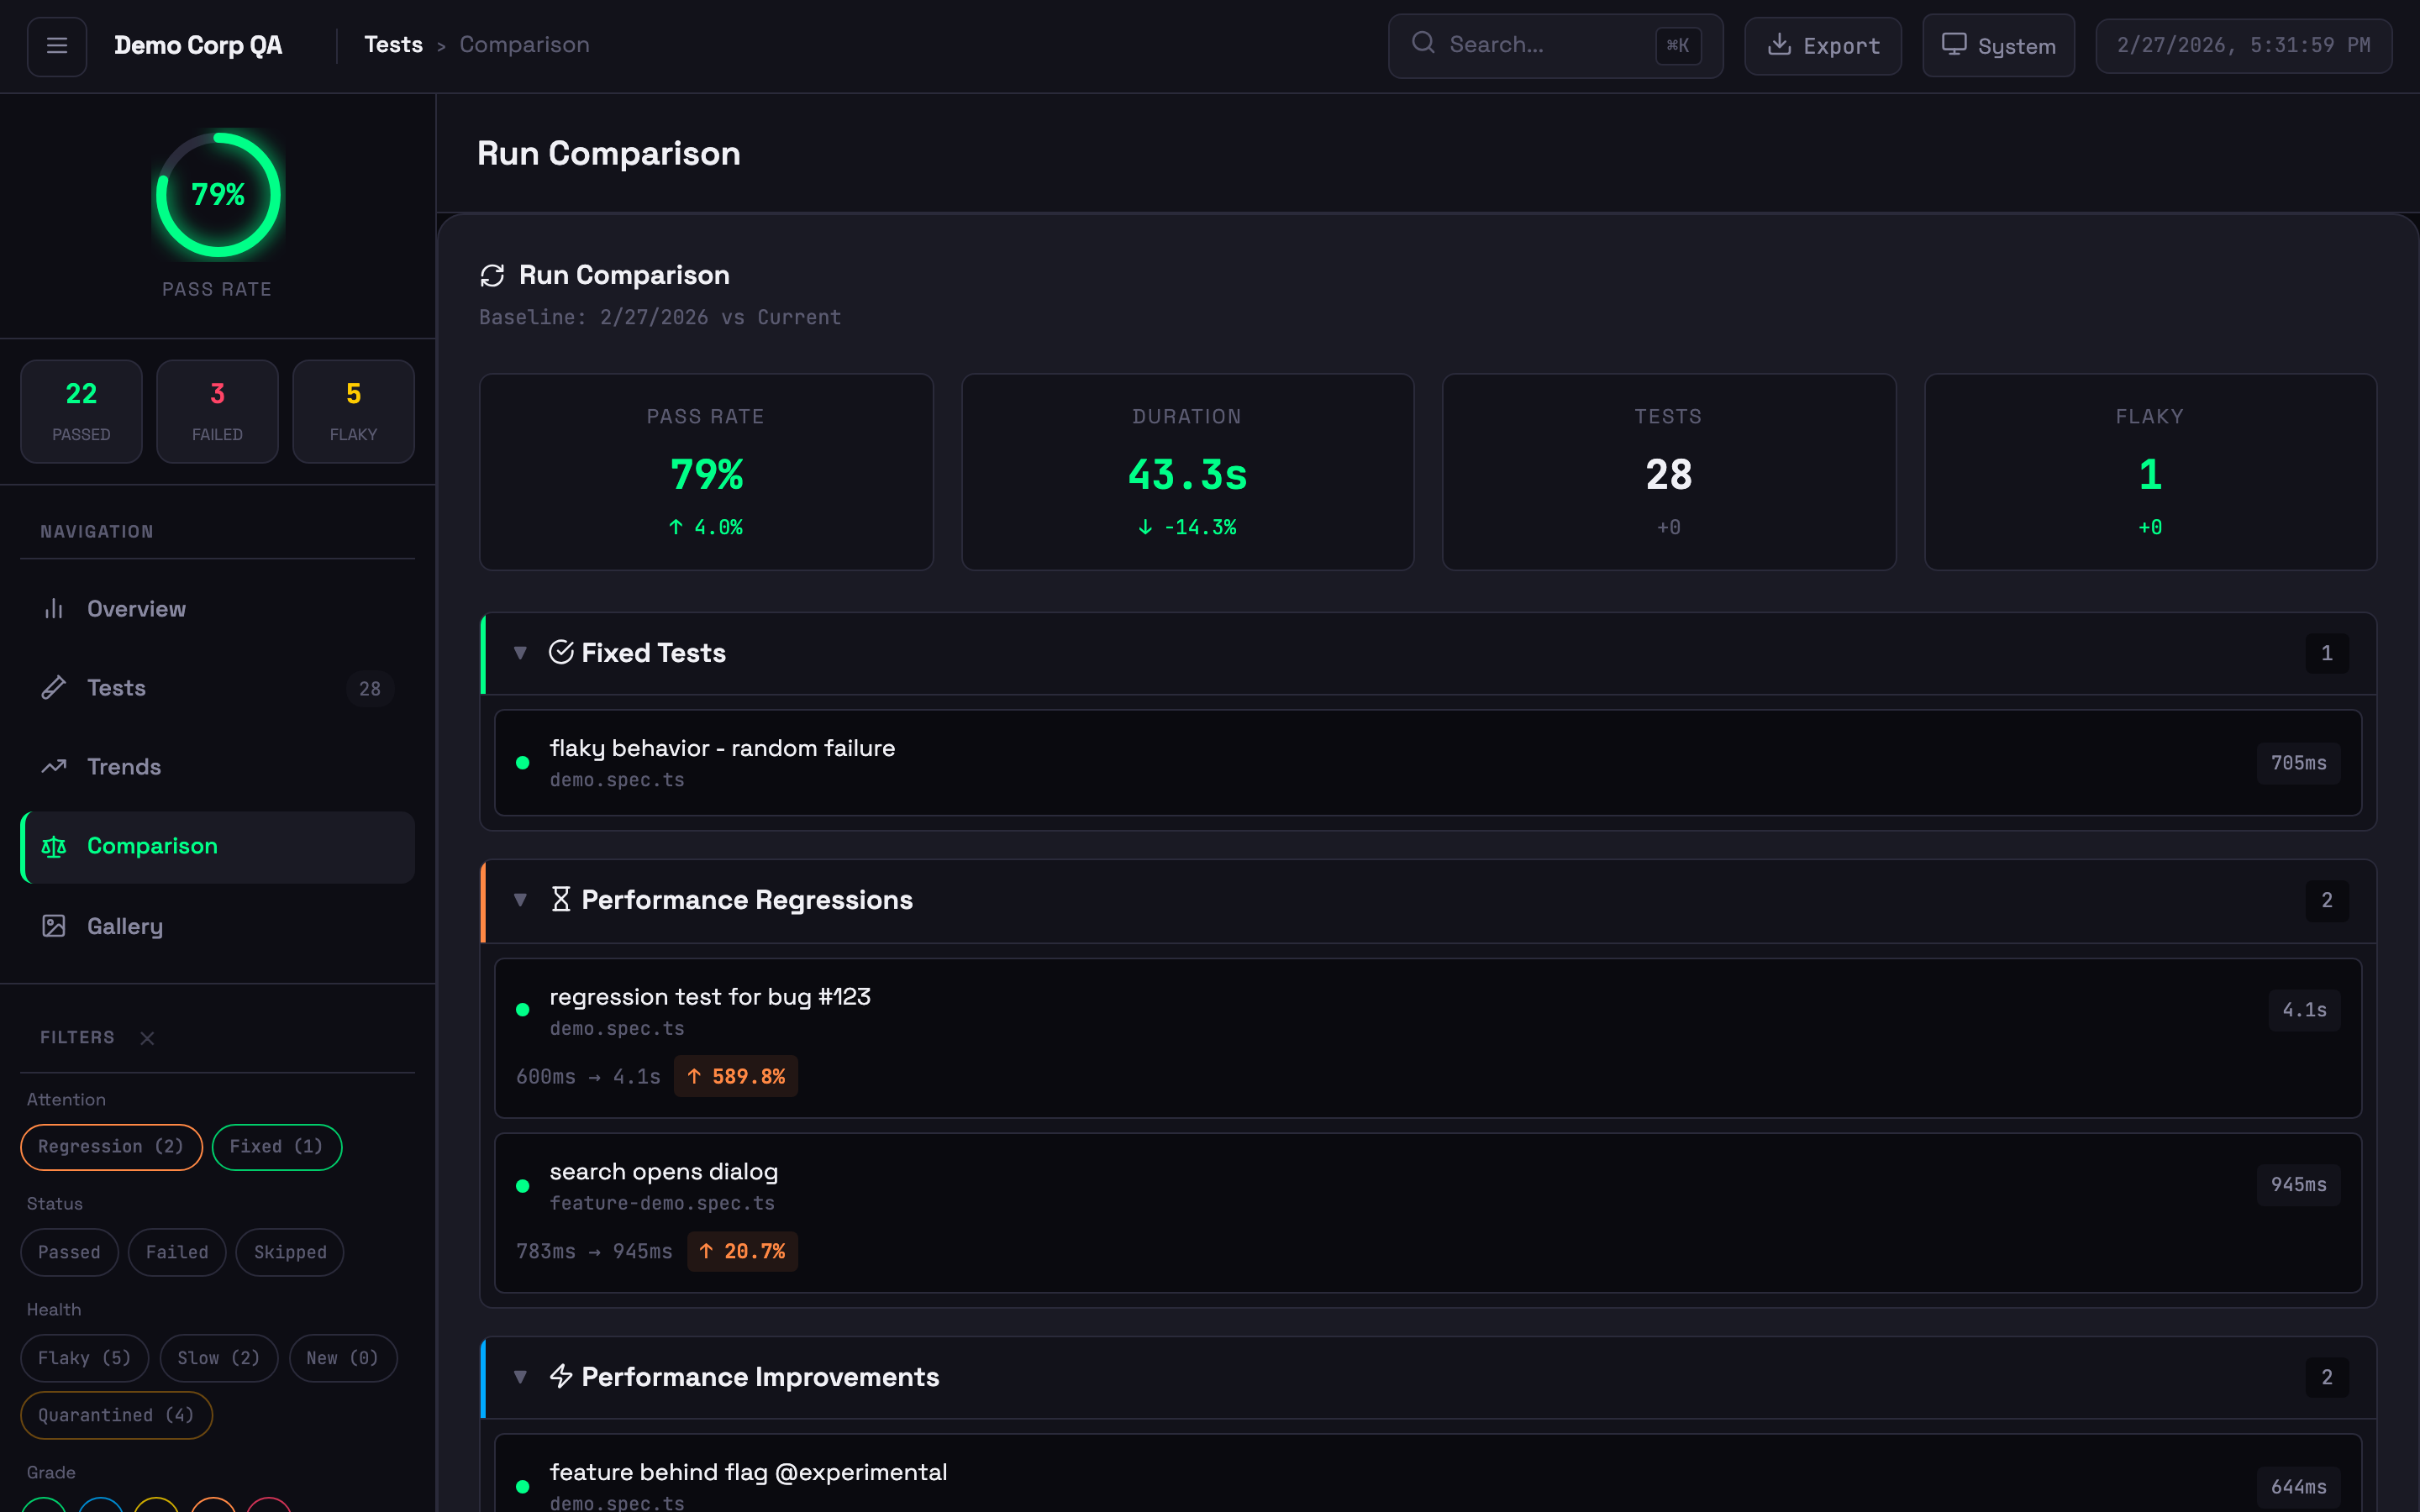 Run comparison showing new failures, performance changes, and baseline diffs
Smart Reporter tracks flakiness across runs, not within a single run:
| | Playwright HTML Report | Smart Reporter | |---|---|---| | Scope | Single test run | Historical across multiple runs | | Criteria | Fails then passes on retry | Failed 30%+ of the time historically | | Use Case | Immediate retry success | Chronically unreliable tests |
Indicators:
- Stable (<10% failure rate) — Unstable (10-30%) — Flaky (>30%) — New (no history)
Starter Features
Themes
6 additional themes beyond the 4 built-in themes (System, Light, Dark, High Contrast): Ocean, Sunset, Dracula, Cyberpunk, Forest, and Rose. Set via config:
reporter: [
  ['playwright-smart-reporter', {
    outputFile: 'smart-report.html',
    licenseKey: process.env.SMART_REPORTER_LICENSE_KEY,
    theme: { preset: 'dracula' },  // ocean, sunset, dracula, cyberpunk, forest, rose
  }],
]
Executive PDF Export
Generate professional PDF reports in 3 themed variants: Corporate, Minimal, and Dark. Includes a style picker modal in the HTML report.
reporter: [
  ['playwright-smart-reporter', {
    outputFile: 'smart-report.html',
    licenseKey: process.env.SMART_REPORTER_LICENSE_KEY,
    exportPdf: true,
  }],
]
Quality Gates
Fail CI builds when test results don't meet your thresholds:
reporter: [
  ['playwright-smart-reporter', {
    outputFile: 'smart-report.html',
    licenseKey: process.env.SMART_REPORTER_LICENSE_KEY,
    qualityGates: {
      minPassRate: 95,
      maxFlakyRate: 5,
      minStabilityGrade: 'B',
    },
  }],
]
Or run as a standalone CLI check:
npx playwright-smart-reporter gate --min-pass-rate 95 --max-flaky-rate 5Exit codes: 0 = all gates passed, 1 = gate failed (use in CI to block deploys).
Flaky Test Quarantine
Automatically detect and quarantine chronically flaky tests. Quarantined tests are tracked in a JSON file and can be excluded from gate failures:
reporter: [
  ['playwright-smart-reporter', {
    outputFile: 'smart-report.html',
    licenseKey: process.env.SMART_REPORTER_LICENSE_KEY,
    quarantine: {
      enabled: true,
      outputFile: '.smart-quarantine.json',
      threshold: 0.3,  // flakiness score 0-1
    },
  }],
]
Custom Branding
Customise the report title, footer, and theme colours:
reporter: [
  ['playwright-smart-reporter', {
    outputFile: 'smart-report.html',
    licenseKey: process.env.SMART_REPORTER_LICENSE_KEY,
    branding: {
      title: 'Acme Corp Test Report',
      footer: 'Generated by QA Team',
    },
    theme: {
      primary: '#6366f1',
      accent: '#8b5cf6',
      success: '#22c55e',
      error: '#ef4444',
      warning: '#f59e0b',
    },
  }],
]
JSON & JUnit Export
Export test results in structured formats for external tools:
reporter: [
  ['playwright-smart-reporter', {
    outputFile: 'smart-report.html',
    licenseKey: process.env.SMART_REPORTER_LICENSE_KEY,
    exportJson: true,
    exportJunit: true,
  }],
]
AI Suite Health Summary
An AI-generated executive summary appears at the top of the Overview tab, combining failure clusters, flakiness trends, performance regressions, and historical pass rate data into natural-language insights. Enabled by default for Starter and Pro users.
To disable (e.g., to preserve AI quota):
reporter: [
  ['playwright-smart-reporter', {
    outputFile: 'smart-report.html',
    licenseKey: process.env.SMART_REPORTER_LICENSE_KEY,
    enableAISuiteHealth: false,  // Disable AI health summary (saves 1 AI request per run)
  }],
]
Configuration
Full Options Reference
reporter: [
  ['playwright-smart-reporter', {
    // Core
    outputFile: 'smart-report.html',
    historyFile: 'test-history.json',
    maxHistoryRuns: 10,
    performanceThreshold: 0.2,

    // Pro license
    licenseKey: process.env.SMART_REPORTER_LICENSE_KEY,

    // Notifications
    slackWebhook: process.env.SLACK_WEBHOOK_URL,
    teamsWebhook: process.env.TEAMS_WEBHOOK_URL,

    // Feature flags (all default to true unless noted)
    enableRetryAnalysis: true,
    enableFailureClustering: true,
    enableStabilityScore: true,
    enableGalleryView: true,
    enableComparison: true,
    enableAIRecommendations: true,
    enableTrendsView: true,
    enableTraceViewer: true,
    enableHistoryDrilldown: false,
    enableAISuiteHealth: true,      // AI health summary in Overview tab (Starter+, uses 1 AI request)
    enableNetworkLogs: true,

    // Step and path options
    filterPwApiSteps: false,
    relativeToCwd: false,

    // Multi-project
    projectName: 'ui-tests',
    runId: process.env.GITHUB_RUN_ID,

    // Network logging
    networkLogFilter: 'api.example.com',
    networkLogExcludeAssets: true,
    networkLogMaxEntries: 50,

    // Thresholds
    stabilityThreshold: 70,
    retryFailureThreshold: 3,
    baselineRunId: 'main-branch-baseline',
    thresholds: {
      flakinessStable: 0.1,
      flakinessUnstable: 0.3,
      performanceRegression: 0.2,
      stabilityWeightFlakiness: 0.4,
      stabilityWeightPerformance: 0.3,
      stabilityWeightReliability: 0.3,
      gradeA: 90,
      gradeB: 80,
      gradeC: 70,
      gradeD: 60,
    },

    // Pro features
    theme: { preset: 'default' },  // default, light, dark, high-contrast, ocean, sunset, dracula, cyberpunk, forest, rose
    exportPdf: false,
    exportJson: false,
    exportJunit: false,
    qualityGates: {},           // { minPassRate, maxFlakyRate, minStabilityGrade }
    quarantine: {},             // { enabled, outputFile, threshold }
    branding: {},               // { logo, title, footer, hidePoweredBy }

    // Advanced
    cspSafe: false,
    maxEmbeddedSize: 5 * 1024 * 1024,
  }],
]
AI Analysis
AI failure analysis is a managed service powered by GPT-4o-mini via the StageWright proxy — no API keys required. To enable it, set your license key (Starter or Pro plan):
export SMART_REPORTER_LICENSE_KEY=your-license-keyOr add licenseKey to your reporter config. When a test fails, the reporter automatically sends the failure context to https://stagewright.dev/api/ai/analyze and returns fix suggestions in the report. Analysis quota depends on your plan:
- Starter (£5/mo): 2,000 AI analyses/month
- Pro (£9/mo): 5,000 AI analyses/month
The free tier does not include AI analysis.
Stability Grades
Composite score (0-100) from three factors:
| Factor | Weight | Description | |---|---|---| | Flakiness | 40% | Inverse of flakiness score | | Performance | 30% | Execution time consistency | | Reliability | 30% | Pass rate from history |
Grades: A (90-100), B (80-89), C (70-79), D (60-69), F (<60). All weights and thresholds are configurable.
Step Filtering
reporter: [
  ['playwright-smart-reporter', {
    filterPwApiSteps: true,  // Only show custom test.step() entries
  }],
]
With filtering on, verbose page.click(), page.fill() steps are hidden — only your named test.step() entries appear.
Multi-Project History
Isolate history per test suite to prevent metric contamination:
reporter: [
  ['playwright-smart-reporter', {
    projectName: 'api',
    historyFile: 'reports/{project}/history.json',
  }],
]
Trace Viewer
Inline Viewer
Click View on any test with traces to open the built-in viewer with film strip, actions panel, before/after screenshots, network waterfall, console messages, and errors.
Local Server
npx playwright-smart-reporter-serve smart-report.htmlServes the report locally with full trace viewer support — no file:// CORS issues.
CLI Viewer
npx playwright-smart-reporter-view-trace ./traces/my-test-trace-0.zipNetwork Logs
Automatically extracted from Playwright trace files — no code changes required. Shows method, URL, status code, duration, and payload sizes. Requires tracing enabled:
use: {
  trace: 'retain-on-failure',  // or 'on'
}
Annotations
| Annotation | Badge | Annotation | Badge |
|---|---|---|---|
| @slow | Amber | @fixme / @fix | Pink |
| @skip | Indigo | @fail | Red |
| @issue / @bug | Red | @flaky | Orange |
| @todo | Blue | Custom | Grey |
test('payment flow', async ({ page }) => {
  test.slow();
  test.info().annotations.push({ type: 'issue', description: 'JIRA-123' });
});
CI Integration
Persisting History
History must persist between runs for flakiness detection and trends to work.
GitHub Actions
- uses: actions/cache@v4
  with:
    path: test-history.json
    key: test-history-${{ github.ref }}
    restore-keys: test-history-

- run: npx playwright test

- uses: actions/cache/save@v4
  if: always()
  with:
    path: test-history.json
    key: test-history-${{ github.ref }}-${{ github.run_id }}
GitLab CI
test:
  cache:
    key: test-history-$CI_COMMIT_REF_SLUG
    paths: [test-history.json]
    policy: pull-push
  script: npx playwright test
CircleCI
- restore_cache:
    keys: [test-history-{{ .Branch }}, test-history-]
- run: npx playwright test
- save_cache:
    key: test-history-{{ .Branch }}-{{ .Revision }}
    paths: [test-history.json]
Azure DevOps
steps:
  - task: Cache@2
    inputs:
      key: 'test-history | "$(Build.SourceBranchName)"'
      restoreKeys: 'test-history |'
      path: test-history.json

  - script: npx playwright test
    continueOnError: true

  - task: PublishPipelineArtifact@1
    inputs:
      targetPath: smart-report.html
      artifact: playwright-smart-report
    condition: always()
CI Auto-Detection
The reporter automatically detects GitHub Actions, GitLab CI, CircleCI, Jenkins, Azure DevOps, and Buildkite. Branch, commit SHA, and build ID are displayed in the report header.
Quality Gates in CI
# GitHub Actions example
- run: npx playwright test
  continue-on-error: true

- run: npx playwright-smart-reporter gate --min-pass-rate 95 --max-flaky-rate 5
  # Exits non-zero if gates fail — blocks the pipeline
Sharded Runs
For consistent history across parallel shards, set runId:
reporter: [
  ['playwright-smart-reporter', {
    runId: process.env.GITHUB_RUN_ID,
  }],
]
Merging History from Multiple Machines
npx playwright-smart-reporter-merge-history \
  shard1/test-history.json \
  shard2/test-history.json \
  -o merged-history.json \
  --max-runs 10
CSP-Safe Mode
For environments with strict Content Security Policy (e.g., Jenkins):
reporter: [
  ['playwright-smart-reporter', { cspSafe: true }],
]
When enabled, the reporter generates companion .css and .js files alongside the HTML report. The HTML references these via <link rel="stylesheet"> and <script src defer> instead of inline <style> and <script> tags. Report data is embedded in <script type="application/json"> tags (not executed by the browser). System fonts are used instead of Google Fonts.
Jenkins CSP configuration — Add to Jenkins script console or startup:
System.setProperty("hudson.model.DirectoryBrowserSupport.CSP",
"script-src 'self' 'unsafe-inline'; style-src 'self'; img-src 'self';")Note: Inline event handlers (
onclick, etc.) still require'unsafe-inline'inscript-src. Full event delegation is planned for a future release.
Cucumber Integration
Works with Playwright + Cucumber frameworks:
import { defineBddConfig } from 'playwright-bdd';

const testDir = defineBddConfig({
  features: 'features/**/*.feature',
  steps: 'steps/**/*.ts',
});

export default defineConfig({
  testDir,
  reporter: [['playwright-smart-reporter']],
});
FAQ
How do I get a license?
Visit stagewright.dev to purchase a Starter (£5/mo) or Pro (£9/mo) plan. Your license key is delivered via email immediately after purchase.
Does Smart Reporter work without a license key?
Yes. All core features (flakiness detection, stability grades, trend analytics, trace viewer, gallery, etc.) are free. AI failure analysis, premium themes, and other paid features unlock when you add a license key.
RangeError with large test suites?
Fixed in v1.0.6. Update: npm install playwright-smart-reporter@latest
Different flakiness than Playwright's HTML report?
They use different methodologies — see Flakiness Detection above.
Report too large or browser hangs?
Enable cspSafe: true to save attachments as files instead of embedding, or reduce maxHistoryRuns. Use maxEmbeddedSize to control the inline trace threshold.
Troubleshooting
| Problem | Cause | Fix |
|---|---|---|
| No history data | History file missing or wrong path | Check historyFile path, use CI caching |
| No network logs | Tracing not enabled | Add trace: 'retain-on-failure' to config |
| No AI suggestions | Missing or invalid license key | Set SMART_REPORTER_LICENSE_KEY env var or add licenseKey to config (Starter or Pro plan required) |
| Mixed project metrics | Shared history file | Use projectName to isolate |
| Starter features not showing | License key missing or expired | Check SMART_REPORTER_LICENSE_KEY env var or licenseKey config |
| Quality gate not failing CI | Gate not run as separate step | Run npx playwright-smart-reporter gate as its own CI step |
Development
npm install
npm run build
npm test        # 666 tests
npm run test:demo
Contributors
- Gary Parker — Creator and maintainer
- Filip Gajic — v1.0.0 UI redesign
- Liam Childs — Parameterized project support
License
MIT — free and paid features in one package. Starter and Pro features require a valid license key from stagewright.dev.