
pstatus-js
v1.1.0
Published
Read Markdown status and todo files across multiple local projects with a CLI, JSON snapshots, and a read-only HTML dashboard.

Maintainers
 jayk
jaykReadme
Overview
pstatus turns the Markdown task files you already keep in one or more repositories into one usable source of information.
You maintain your work in simple local STATUS.md or TODO.md-style files, close to the code they describe. pstatus reads those files across projects, builds a current snapshot, and gives you two ways to use it:
- query everything from the command line
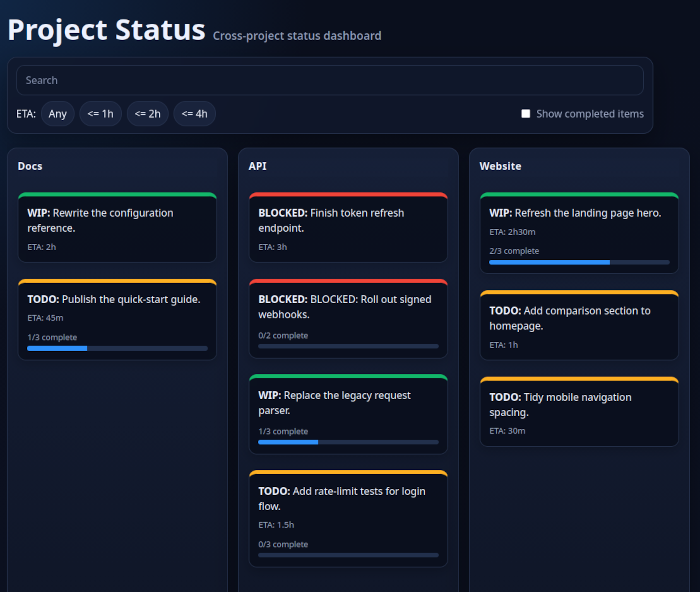
- browse everything in a read-only HTML dashboard
This makes it easy to work with todos that are normally scattered across multiple repos. Instead of opening projects one by one, you can see what needs attention across all of them in one place and ask practical questions such as:
- What should I work on next?
- What is blocked?
- What is already in progress?
- What can I finish in the next 30 minutes, 1 hour, or 2 hours?
- Which tasks match a project, tag, status, or other metadata value?
pstatus is for people who want to keep task tracking near their code, in Markdown, without moving that information into a separate database or project management system. It supports flexible metadata, works across multiple projects, and makes your existing repo-local task files much easier to browse, filter, and query.
In short: you keep your todos in Markdown, near your code, and pstatus turns them into something you can actually use across all your projects.
pstatus does not watch your files. It does not update by itself. Your STATUS.md files are the source of truth. The generated snapshot and the dashboard change only when you run a CLI command such as pstatus -r.
Install
Install the npm package globally:
npm install -g pstatus-jsor
yarn global add pstatus-jsThis installs the pstatus CLI command.
Getting Started
This section gives you a complete setup from scratch.
1. Prepare project status files
Create one STATUS.md file in each project that you want to track.
Example:
---
2026-08-20: TODO: Write the release notes. ETA:1h type:write

Explain the main changes for the next release.
You can also add a checklist:
---
2026-08-20: WIP: Finish API cleanup. ETA:2h type:code

- [x] Remove dead endpoint.
- [ ] Update tests.
- [ ] Update docs.
2. Create a configuration file
Create pstatus.conf in the directory where you want to run pstatus, pass the file path with -c, or set PSTATUS_CONFIG.
pstatus.conf is the standard config filename.
Example:
{
  "files": {
    "Project A": ["../project-a/STATUS.md"],
    "Project B": [
      {
        "label": "Core",
        "file": "../project-b/STATUS.md"
      },
      {
        "label": "Javascript lib",
        "file": "../project-b-lib/STATUS.md"
      }
    ]
  },
  "output": "./pstatus-output",
  "data_file": "pstatus-data.json",
  "history": "./pstatus-output/history",
  "dashboard": "./pstatus-output/dashboard.html",
  "custom_css": "./pstatus-theme.css",
  "page_title": "PStatus",
  "source_path_depth": 2
}
Use arrays for all files values. A project can have one file or many files. Each array item can be either:
- a string file path
- an object with
labelandfile
If you provide a file-level label, pstatus shows it on the task card and uses it in CLI output for records from that file.
pstatus also shows that label in the task detail dialog.
source_path_depth limits how much path information pstatus stores in generated data. With the default value 2, a source path such as dev/projects/vouchsafe/getvouchsafe/STATUS.md becomes vouchsafe/getvouchsafe/STATUS.md in pstatus-data.json and in the dashboard.
All relative paths in the config resolve relative to the config file location.
3. Generate the snapshot
Run:
pstatus -rThis command reads the configured STATUS.md files and writes a fresh snapshot to the output directory.
If one or more status files fail to load, pstatus does not replace the current snapshot unless you use:
pstatus -r --overwrite-on-error4. Check the results
After pstatus -r, look in the output directory.
You will see at least:
pstatus-data.json- the dashboard HTML file, if
dashboardis a local file path
5. Query the snapshot in the CLI
Run:
pstatusThis command reads the current generated snapshot. It does not reread your source files.
6. Open or serve the dashboard
If your config has a local dashboard file path, run:
pstatus -oThis opens the configured dashboard. It does not start a server.
To refresh the dashboard data, run pstatus -r first.
Quick Start Example
Create these files.
STATUS.md:
---
2026-08-20: TODO: Write the migration guide. ETA:1h type:write

Explain the breaking changes.pstatus.conf:
{
  "files": {
    "Docs": ["./STATUS.md"]
  },
  "output": "./pstatus-output",
  "data_file": "pstatus-data.json"
}
Run these commands:
pstatus -r
pstatus
Expected result:
pstatus-output/pstatus-data.jsonexists- the CLI shows the task summary
Write Tasks In STATUS.md
Use --- to start a section.
Dated record format
Use this format for normal task records:
YYYY-MM-DD: STATUS: TITLE metadata:value metadata:valuepstatus also accepts the date without the first colon:
YYYY-MM-DD STATUS: TITLE metadata:value metadata:valueThe form with the colon after the date is still the preferred form.
Example:
---
2026-08-20: TODO: Write the onboarding guide. ETA:1.5h type:write priority:high

Explain the local setup steps.
Supported status values:
BLOCKEDWIPTODODONE
Checklist section format
You can also use a checklist-only section.
Each top-level checklist item becomes one task.
Example:
---
- [x] Align the config format.
  - [x] Update the main config file.
  - [x] Update the example config file.

- [ ] Finish the network layer.
  - [ ] Add peer link support.
  - [ ] Add tests.
For checklist-only sections:
- the file mtime becomes the date
- child checklist items become task progress
- deeper nested checklist items are ignored by
pstatus
Metadata
Metadata uses name:value.
Example:
ETA:1h type:write priority:highKeep metadata values on one token. Do not put spaces in a metadata value.
HTML in source files
pstatus removes raw HTML tags from titles, bodies, and checklist text when it builds pstatus-data.json.
Use plain text or Markdown in STATUS.md files. Do not rely on inline HTML.
ETA
Use ETA when you want to ask, “What can I finish in the time I have?”
Supported ETA formats:
30m1h1.5h2h30m
Use the CLI
The CLI reads the current snapshot unless you use -r.
Show the current summary
pstatusRecords stay grouped by project. Within each project, pstatus shows the lowest-ETA items first.
Regenerate the snapshot
pstatus -rImportant: nothing updates until you run a regenerate command.
Important: generated snapshots do not store full source paths by default. pstatus trims stored paths with source_path_depth.
Query the current snapshot
pstatus type:write
pstatus status:WIP
pstatus project:docs eta:1h
pstatus eta:1h
pstatus eta:=30m
pstatus label:backend
List project query tokens
pstatus -lUse pstatus -l to print ready-to-copy project:... query tokens for all configured projects.
Use a specific config file
pstatus -c work-config.json -rOpen the configured dashboard
pstatus -oCreate a static dashboard file
pstatus --static
pstatus --static team-status.html
Create a static dashboard for one project only
Use this when you want to publish one project snapshot into that repository.
pstatus -r --static status.html --static-project "Project A"This command embeds only the selected project in the generated HTML file.
Use the Dashboard
The dashboard shows:
- one column per configured project label
- task cards for matching items
- task details in a popup dialog
- file labels on cards and in task details when configured
- checklist progress for checklist-backed tasks
- search, ETA filters, a hide-empty-projects toggle, and a completed-items toggle
The dashboard is read-only.
The dashboard does not refresh source files. Run pstatus -r to refresh the generated data.
Search
Use plain terms to search across project, file label, status, title, body, date, metadata, and checklist text.
Example:
revocationUse name:value to search a field or metadata key.
Examples:
project:docs
label:backend
status:WIP
date:2026-08-20
type:write
priority:high
eta:1h
eta:=30m
All terms use AND logic.
Search terms are regular expressions. If a query contains an invalid regular expression, pstatus shows an error.
For eta:value queries:
eta:1hmeans 1 hour or lesseta:=1hmeans exactly 1 hour- if
valueis not a recognized ETA format,pstatustreats it as a regular expression against the raw ETA text
ETA filters
Use the ETA buttons when you have a limited amount of time.
Examples:
<= 1hshows tasks that take 1 hour or less<= 2hshows tasks that take 2 hours or less<= 4hshows tasks that take 4 hours or less
If a task has no parsed ETA, it does not appear when an ETA filter is active.
Serve the Dashboard
Serve the output directory with any static file server.
Examples:
Node.js
npx http-server ./pstatus-outputPython
python -m http.server --directory ./pstatus-output 8080Ruby
ruby -run -e httpd ./pstatus-output -p 8080You can use any other static file server that you prefer.
Create a Static Snapshot
Use a static snapshot when you want one self-contained HTML file.
Create the default static file:
pstatus --staticCreate a named static file:
pstatus --static my-status.htmlCreate a named static file for one project only:
pstatus --static my-status.html --static-project "Project A"The static file contains the HTML, CSS, JavaScript, and snapshot data.
How Data Flows
The flow is simple:
- You edit
STATUS.mdfiles. - You run
pstatus -r. pstatuswrites a newpstatus-data.jsonsnapshot.- The CLI and dashboard read that generated snapshot.
If you do not run pstatus -r, the CLI and dashboard continue to show the old snapshot.
Reference: Configuration File
files
Required.
Type: object.
Each key is a project label. Each value is an array of one or more entries.
Each array item can be either a string path or an object with label and file.
Example:
{
  "files": {
    "Docs": ["../docs/STATUS.md"],
    "Server": [
      "../server/STATUS.md",
      {
        "label": "worker",
        "file": "../server/STATUS-extra.md"
      }
    ]
  },
  "source_path_depth": 2
}
If you use a file object label, pstatus shows that label on the task card, in the task detail dialog, and as a prefix in CLI output for tasks from that file.
Config lookup
pstatus loads config in this order:
- the file passed with
-c - the path from
PSTATUS_CONFIG pstatus.confin the current working directory
output
Required.
Type: string.
This directory stores the current snapshot.
data_file
Optional.
Type: string.
Default: pstatus-data.json
This value sets the generated snapshot file name inside the output directory.
history
Optional.
Type: string.
If set, pstatus -r also writes timestamped full snapshots here.
dashboard
Optional.
Type: string.
Use a local file path if you want pstatus -r to write the dynamic dashboard file.
Use an http or https URL if you want pstatus -o to open that URL.
custom_css
Optional.
Type: string.
This is a path to a CSS file. pstatus appends that CSS after the base dashboard CSS.
page_title
Optional.
Type: string.
Default: PStatus
This value sets the dashboard page title and visible heading.
source_path_depth
Optional.
Type: non-negative integer.
Default: 2
This value controls how many parent directories pstatus stores in generated snapshot paths.
Examples:
- depth
0:STATUS.md - depth
1:getvouchsafe/STATUS.md - depth
2:vouchsafe/getvouchsafe/STATUS.md
Use this setting to avoid leaking full filesystem paths in pstatus-data.json, dashboard detail views, and static exports.
Path rules
All relative paths in the config file resolve relative to the config file location.
Reference: STATUS.md
Section start
Use --- to start a section.
Dated record syntax
YYYY-MM-DD: STATUS: TITLE metadata:value metadata:valueAlso accepted:
YYYY-MM-DD STATUS: TITLE metadata:value metadata:valueChecklist-only section syntax
Top-level checklist items become records. One level of child checklist items becomes task progress.
Metadata rules
- metadata keys are case-insensitive
- repeated keys become arrays in the snapshot
- unknown metadata is preserved
ETA rules
Recognized ETA values become normalized minutes in derived data.
Error rules
Malformed records are warned about and ignored.
Raw HTML is removed before data is written to the snapshot.
Reference: Dashboard
Dynamic mode
The dynamic dashboard reads the configured snapshot file, which defaults to pstatus-data.json, from the output directory.
Static mode
The static dashboard embeds snapshot data directly in one HTML file.
Layout
- one column per configured project label
- per-column scrolling on desktop
- horizontal column scrolling on mobile
- scroll indicators for horizontal board navigation
- task details in a popup dialog
- file labels on cards and in detail views when configured
- checklist progress bars for checklist-backed tasks
Hide empty projectsis enabled by default
Controls
- search
- ETA filters
- hide empty projects
- show completed items
Reference: CSS Customization
Base dashboard assets:
src/dashboard.htmlsrc/dashboard.css
Use custom_css to override the base theme.
Important CSS variables include:
--page-bg--panel-bg--panel-border--text-main--text-muted--danger--success--warning--done--progress-fill--check-done
Example:
:root {
  --page-bg: #05070d;
  --accent-strong: #c2410c;
  --progress-fill: #c2410c;
}
Troubleshooting
The dashboard shows old data
Run:
pstatus -rThe CLI shows old data
Run:
pstatus -rA file failed to load
Check the warning output from pstatus -r.
The snapshot was not replaced
This happens when one or more configured files fail to load.
Use this only if you want to keep partial results:
pstatus -r --overwrite-on-errorThe dashboard does not open
Check the dashboard setting in pstatus.conf.
Search gives an error
Your search term probably contains an invalid regular expression.
Design Notes
- The dashboard is read-only.
pstatusdoes not scan for projects automatically.pstatusdoes not watch source files.pstatusupdates generated data only when you run CLI commands such aspstatus -r.