
py-viz
v1.0.1
Published
Local data visualization studio — Python rendering, Node.js UI

Maintainers
 mohanchinnappan
Readme
py-viz Studio
A local data visualization studio — Python does the rendering, Node.js serves the UI.
Pick a chart type, edit the JSON spec in a Monaco editor, hit Render, and see the result instantly via WebSocket.
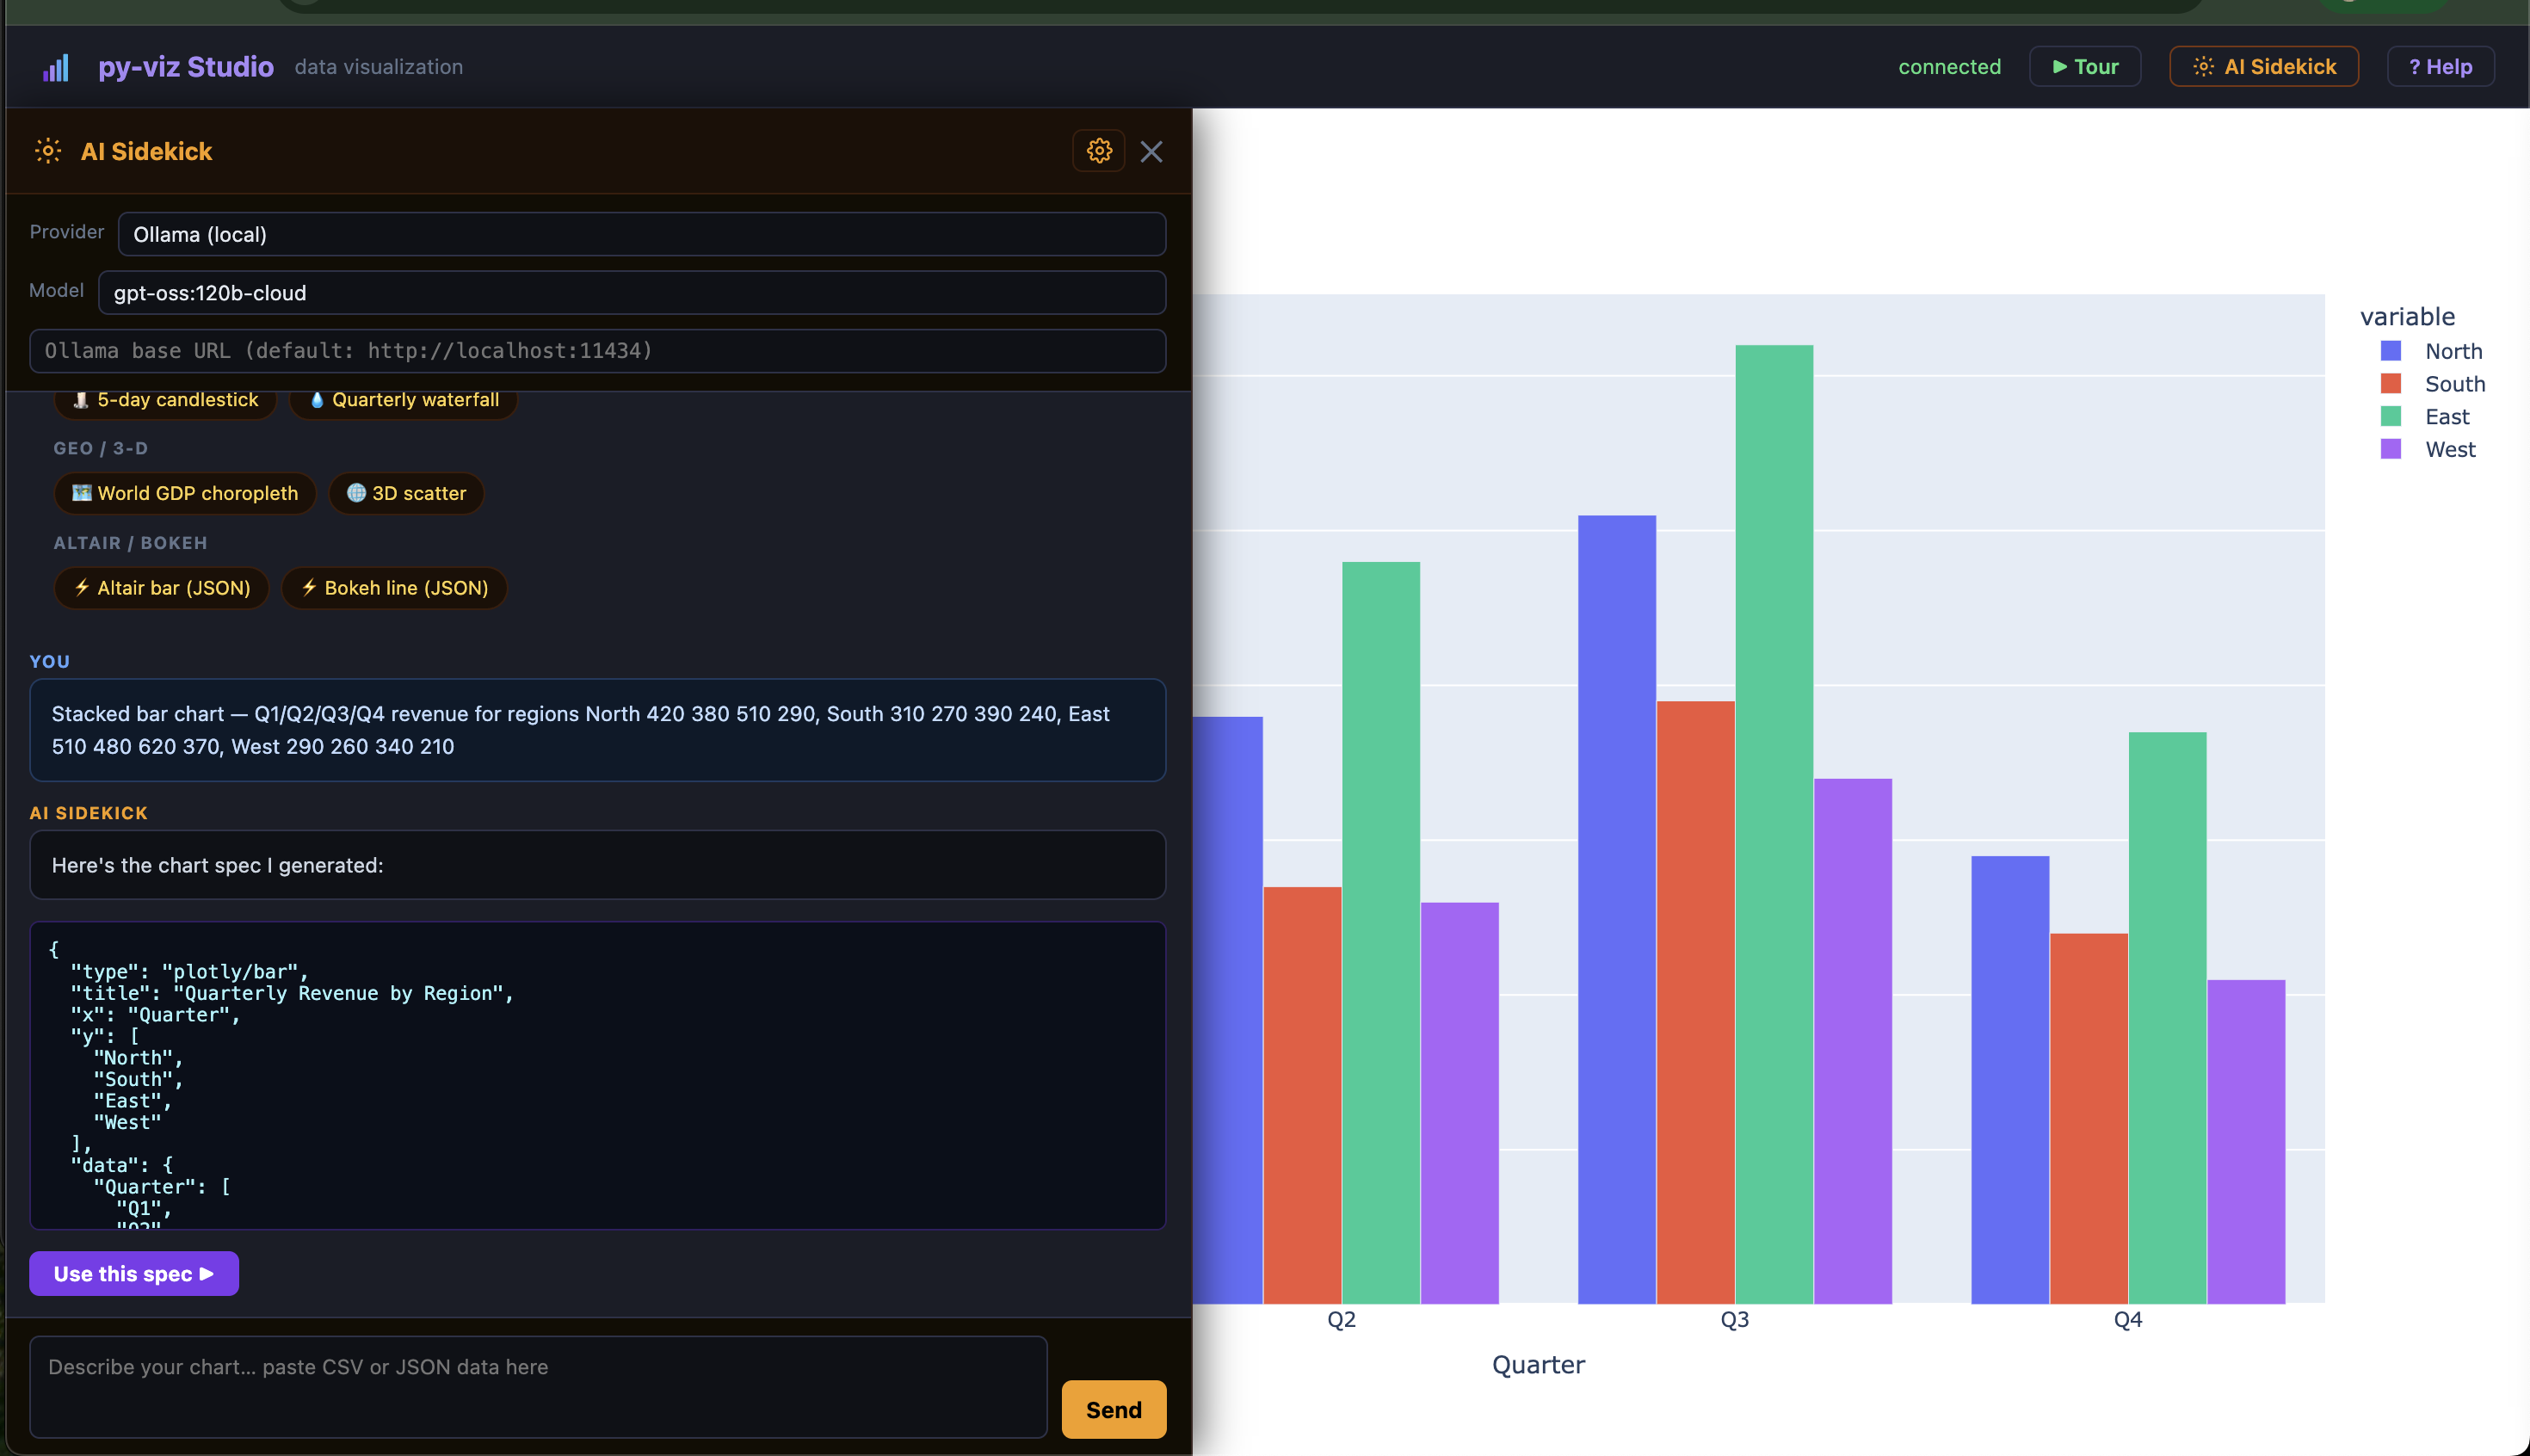
Ask the AI Sidekick to generate a chart from plain English, raw CSV, or JSON data.
Screenshots
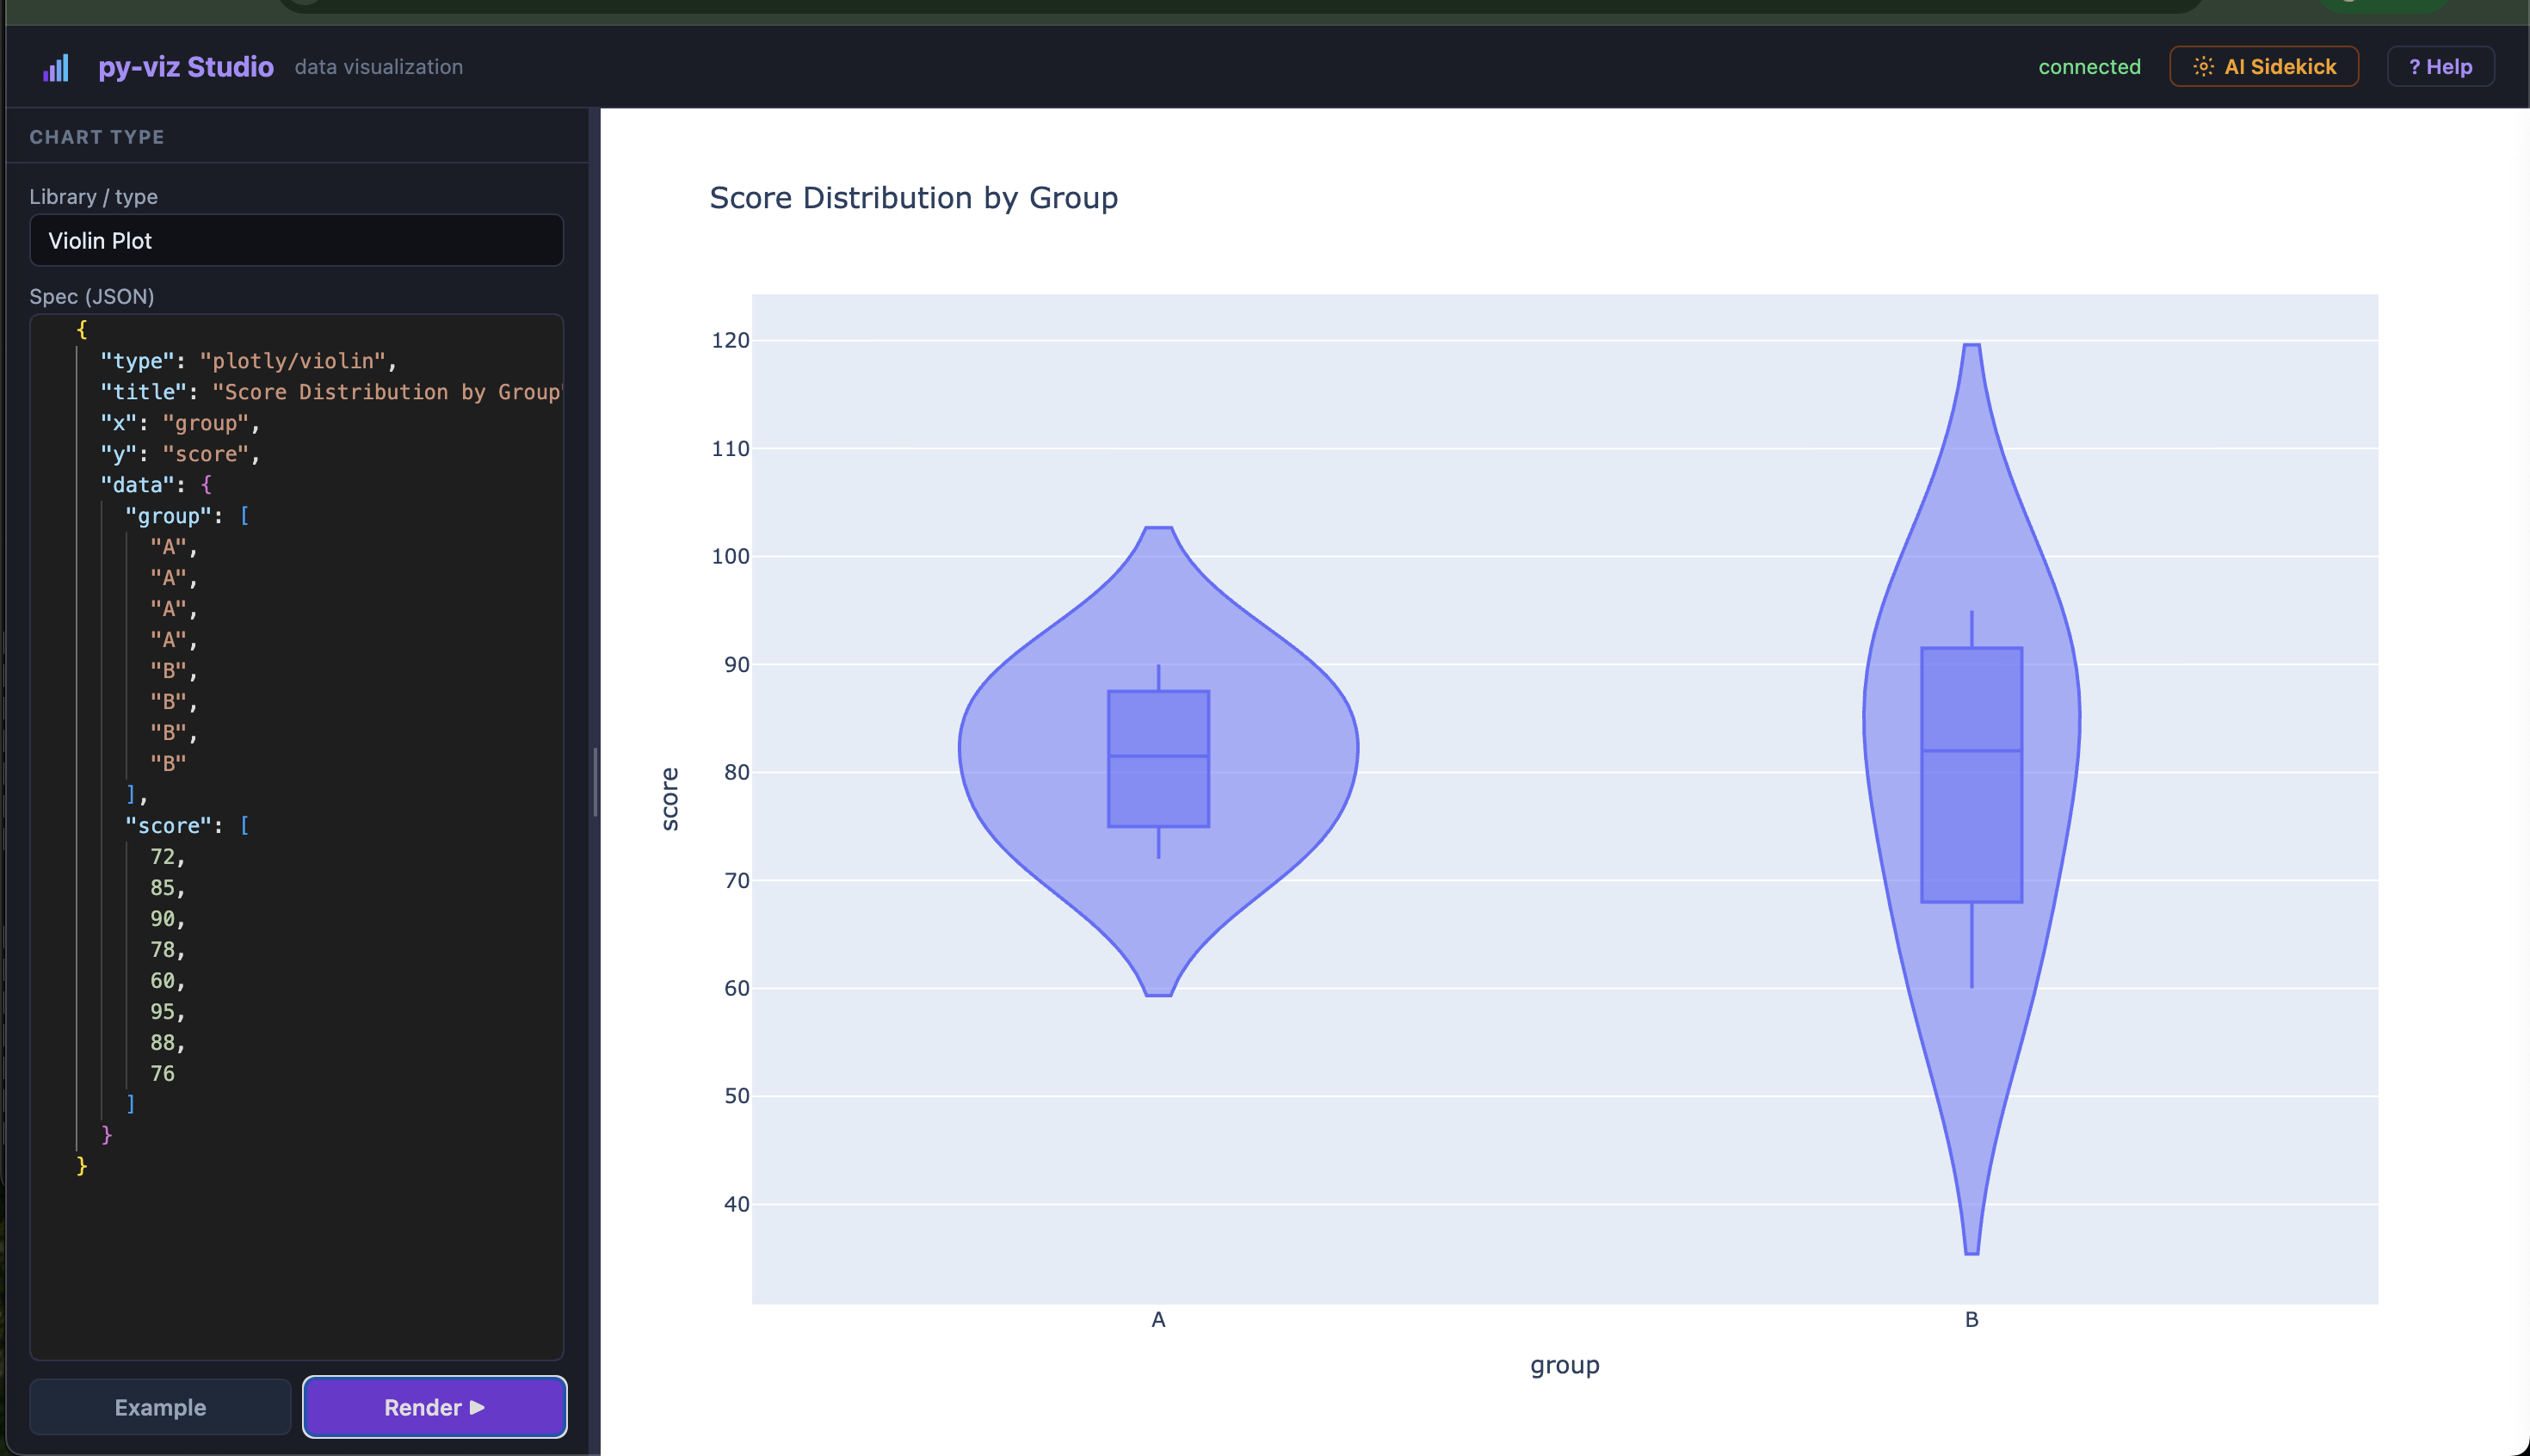
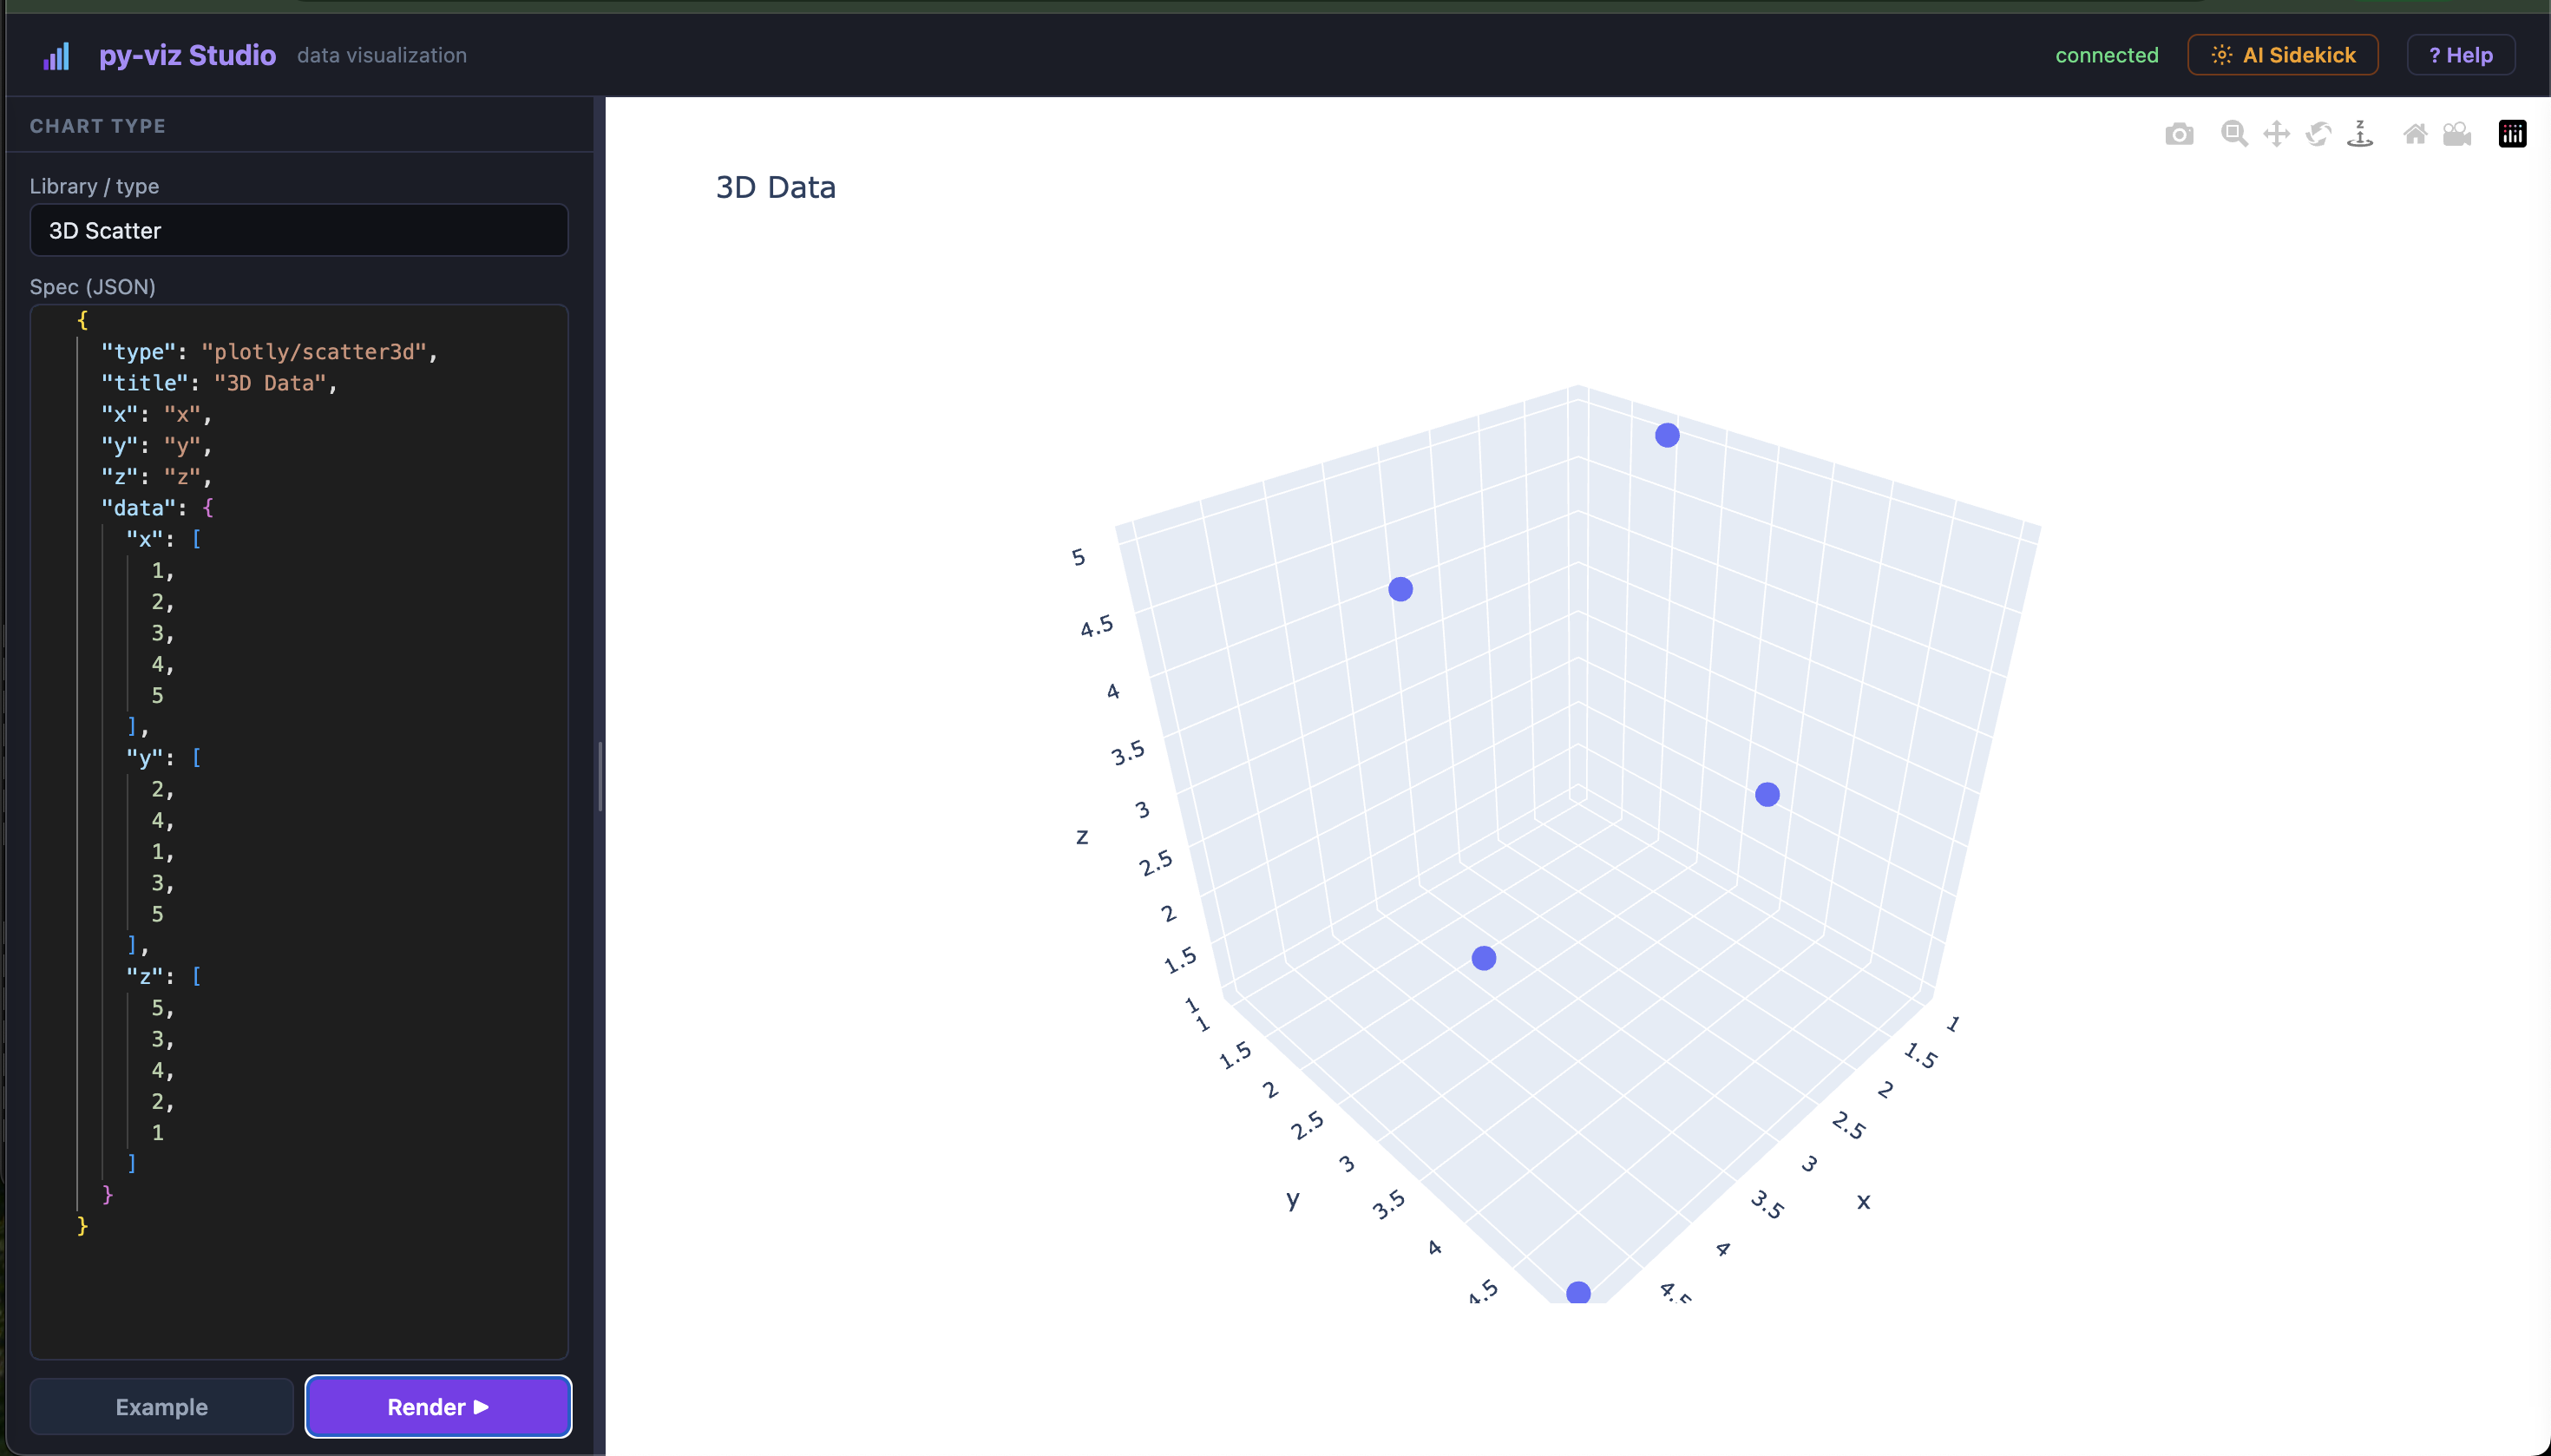
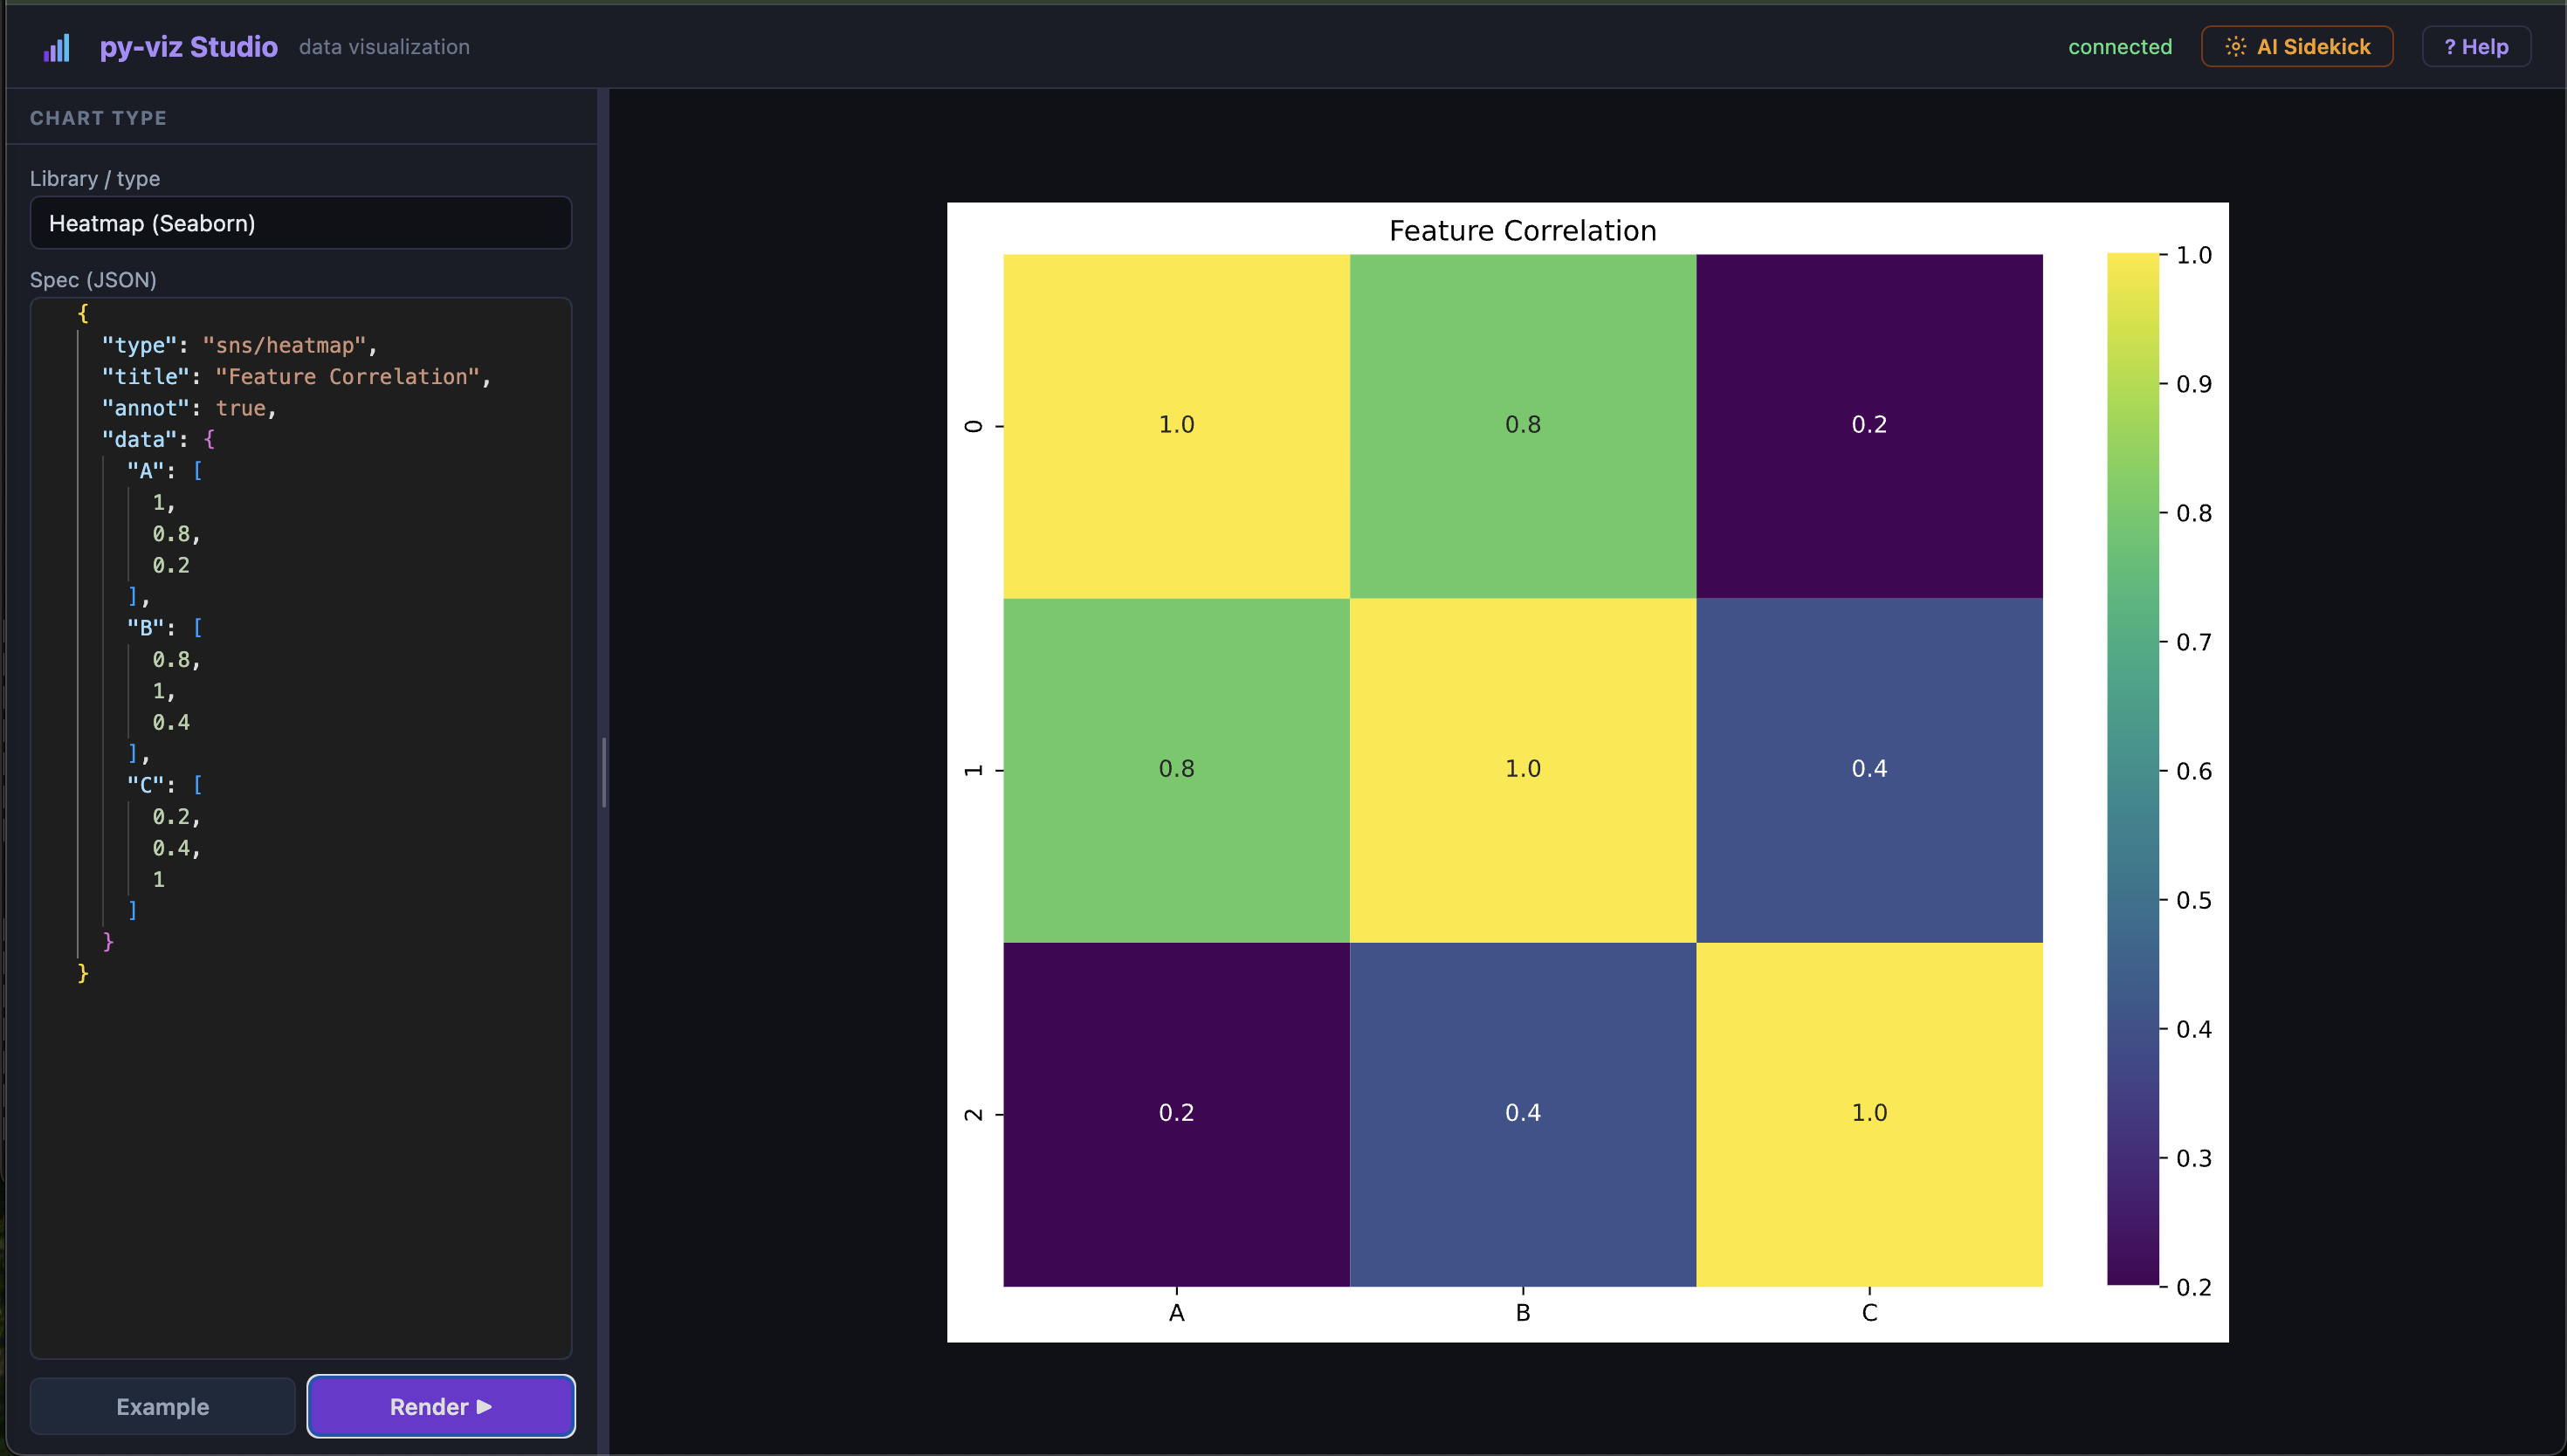
Features
- 25+ chart types across Plotly, Matplotlib, Seaborn, Altair, and Bokeh
- Monaco editor for the JSON spec (syntax highlighting, auto-format, bracket matching)
- Live WebSocket preview — no page reloads
- Animated splitter — drag to resize the left panel
- Context-sensitive help drawer — field reference and annotated example per chart type
- Python source viewer — read-only Monaco panel showing the exact handler code for the selected chart
- AI Sidekick — LLM-powered chart generator with clickable example pills; supports Ollama, Claude, OpenAI, xAI, Gemini; API keys stored in localStorage via the built-in Settings panel; remembers last-used model per provider
- Guided tour — step-by-step walkthrough of the UI (click Tour in the header)
- Splash screen on startup
- Graceful shutdown on Ctrl+C — Python subprocess exits cleanly
Prerequisites
| Requirement | Version | |-------------|---------| | Node.js | ≥ 18 | | Python | ≥ 3.9 |
Python dependencies are installed automatically into a local .py-viz-venv/ on first run.
Install
npm install -g py-vizUsage
# Start the studio (opens browser automatically)
py-viz serve

# Custom port
py-viz serve --port 3567

# Custom port, no auto-open
py-viz serve --port 3567 --no-open

# Enable the AI Sidekick panel
py-viz serve --enable-ai

# All options together
py-viz serve --port 3567 --enable-ai

# Open the browser manually (server already running)
py-viz open --port 3567
On first run, py-viz creates .py-viz-venv/ in the current directory and installs all Python dependencies (~1 min).
Subsequent starts are instant.
Guided Tour
Click the Tour button in the header for a step-by-step walkthrough of:
- Chart type selector
- Monaco JSON spec editor
- Render button
- Animated splitter
- Chart preview area
- Help drawer (Fields + Python source tabs)
- AI Sidekick (when enabled)
The tour highlights each UI element with an animated overlay and explains what it does.
AI Sidekick
The AI Sidekick lets you describe a chart in plain English — or paste raw CSV or JSON data — and have an LLM generate the py-viz spec automatically.
Enable
py-viz serve --enable-aiThe gold AI Sidekick button appears in the header only when the flag is set.
Supported providers
| Provider | Key source |
|----------|-----------|
| Ollama | No key needed — models auto-discovered via /api/tags |
| Claude (Anthropic) | AI Settings panel or ANTHROPIC_API_KEY env var |
| OpenAI | AI Settings panel or OPENAI_API_KEY env var |
| xAI (Grok) | AI Settings panel or XAI_API_KEY env var |
| Google Gemini | AI Settings panel or GEMINI_API_KEY env var |
A key entered in the Settings panel takes precedence over the environment variable.
# Env vars still work if preferred
ANTHROPIC_API_KEY=sk-ant-... py-viz serve --enable-ai
AI Settings panel
Click the ⚙ gear icon in the AI Sidekick header to open the Settings panel.
- Enter API keys for Claude, OpenAI, xAI, and Gemini
- Keys are stored in
localStorage— they never leave your browser; they are sent only during a chat request over your local loopback connection - Each field has a show/hide (👁) toggle and a clear (✕) button
- Save keys commits to localStorage, then reloads the provider list
- Clear all keys removes every saved key after confirmation
- Green border on a key field = key is present
Provider + model selections are also remembered per provider. The Ollama base URL is persisted too.
Workflow
- Open the AI Sidekick drawer (gold button, slides in from the left)
- Select provider and model
- Click a pill to use a pre-built example, or type your own request
- Paste CSV or JSON inline if needed
- Click Send or press Cmd/Ctrl+Enter
- Review the generated spec
- Click Use this spec ▶ — spec loads into Monaco, chart type is set, rendering starts automatically
Example prompts
Bar chart of monthly sales: Jan 120, Feb 95, Mar 140, Apr 160, May 200

Scatter plot from this CSV:
name,height,weight
Alice,165,60
Bob,180,80
Carol,170,65

Choropleth world map of GDP: USA 25000, China 18000, Germany 4200

Seaborn violin plot of salaries by department:
dept,salary
Eng,120
Eng,130
Sales,90
Sales,95

Line chart from this JSON:
[{"month":"Jan","revenue":100},{"month":"Feb","revenue":120}]
Supported Chart Types
Plotly (interactive HTML)
| Type | Key |
|------|-----|
| Bar | plotly/bar |
| Line | plotly/line |
| Scatter | plotly/scatter |
| Bubble | plotly/bubble |
| Pie | plotly/pie |
| Histogram | plotly/histogram |
| Area | plotly/area |
| Box | plotly/box |
| Violin | plotly/violin |
| Heatmap | plotly/heatmap |
| Sunburst | plotly/sunburst |
| Treemap | plotly/treemap |
| Funnel | plotly/funnel |
| Waterfall | plotly/waterfall |
| Candlestick | plotly/candlestick |
| Choropleth | plotly/choropleth |
| 3D Scatter | plotly/scatter3d |
| 3D Surface | plotly/surface |
Matplotlib (SVG)
mpl/bar · mpl/line · mpl/scatter · mpl/histogram · mpl/pie · mpl/area
Seaborn (SVG)
sns/heatmap · sns/pairplot · sns/boxplot · sns/violin · sns/distribution · sns/regression
Altair / Vega-Lite (interactive HTML)
altair/bar · altair/line · altair/scatter · altair/area · altair/heatmap
Bokeh (interactive HTML)
bokeh/line · bokeh/bar · bokeh/scatter
JSON Spec Format
Every chart is driven by a JSON spec sent over WebSocket:
{
  "type": "plotly/bar",
  "title": "Sales by Region",
  "x": "region",
  "y": "sales",
  "data": {
    "region": ["North", "South", "East", "West"],
    "sales": [420, 380, 510, 290]
  }
}
The data field is always column-oriented: each key is a column name, value is an array.
Click ? Help in the header for a full field reference for the selected chart type.
REST API
curl -X POST http://localhost:3000/api/render \
  -H 'Content-Type: application/json' \
  -d '{"type":"plotly/bar","x":"k","y":"v","data":{"k":["A","B"],"v":[10,20]}}'
Returns { "output": "<html…>", "format": "html" }.
Build (obfuscated dist)
npm run buildObfuscates all JS into dist/ via obfuscli.
The postbuild script removes .py-viz-venv and node_modules from the output automatically.
Architecture
Browser  ──WS──►  Node.js (Express + ws)  ──stdin──►  Python subprocess
                  ├── /api/render  (REST)  ◄──stdout──  (renderer.py)
                  ├── /api/ai/*    (LLM proxy)
                  │    ├── Ollama  (local, no key)
                  │    ├── Claude  (ANTHROPIC_API_KEY)
                  │    ├── OpenAI  (OPENAI_API_KEY)
                  │    ├── xAI     (XAI_API_KEY)
                  │    └── Gemini  (GEMINI_API_KEY)
                  └── /api/config  (feature flags)
See ARCH.md and STACK.md for full details.
Project Structure
py-viz/
├── bin/cli.js              Commander CLI  (serve, open, --enable-ai)
├── server/
│   ├── app.js              Express + SIGINT handler + feature flags
│   ├── ws.js               WebSocket bridge
│   ├── python.js           Subprocess manager + venv setup
│   └── ai.js               LLM proxy (Ollama / Claude / OpenAI / xAI / Gemini)
├── public/
│   ├── index.html          Studio UI (splash, guided tour, drawers, splitter, pills)
│   └── app.js              Monaco editors, WS client, AI Sidekick, localStorage
└── python/
    ├── renderer.py         stdin/stdout JSON loop
    ├── requirements.txt
    └── charts/
        ├── plotly_charts.py
        ├── mpl_charts.py
        ├── sns_charts.py
        ├── altair_charts.py
        └── bokeh_charts.py
License
MIT © Mohan Chinnappan