
pyz-knowledge-graph-vue
v1.1.2
Published
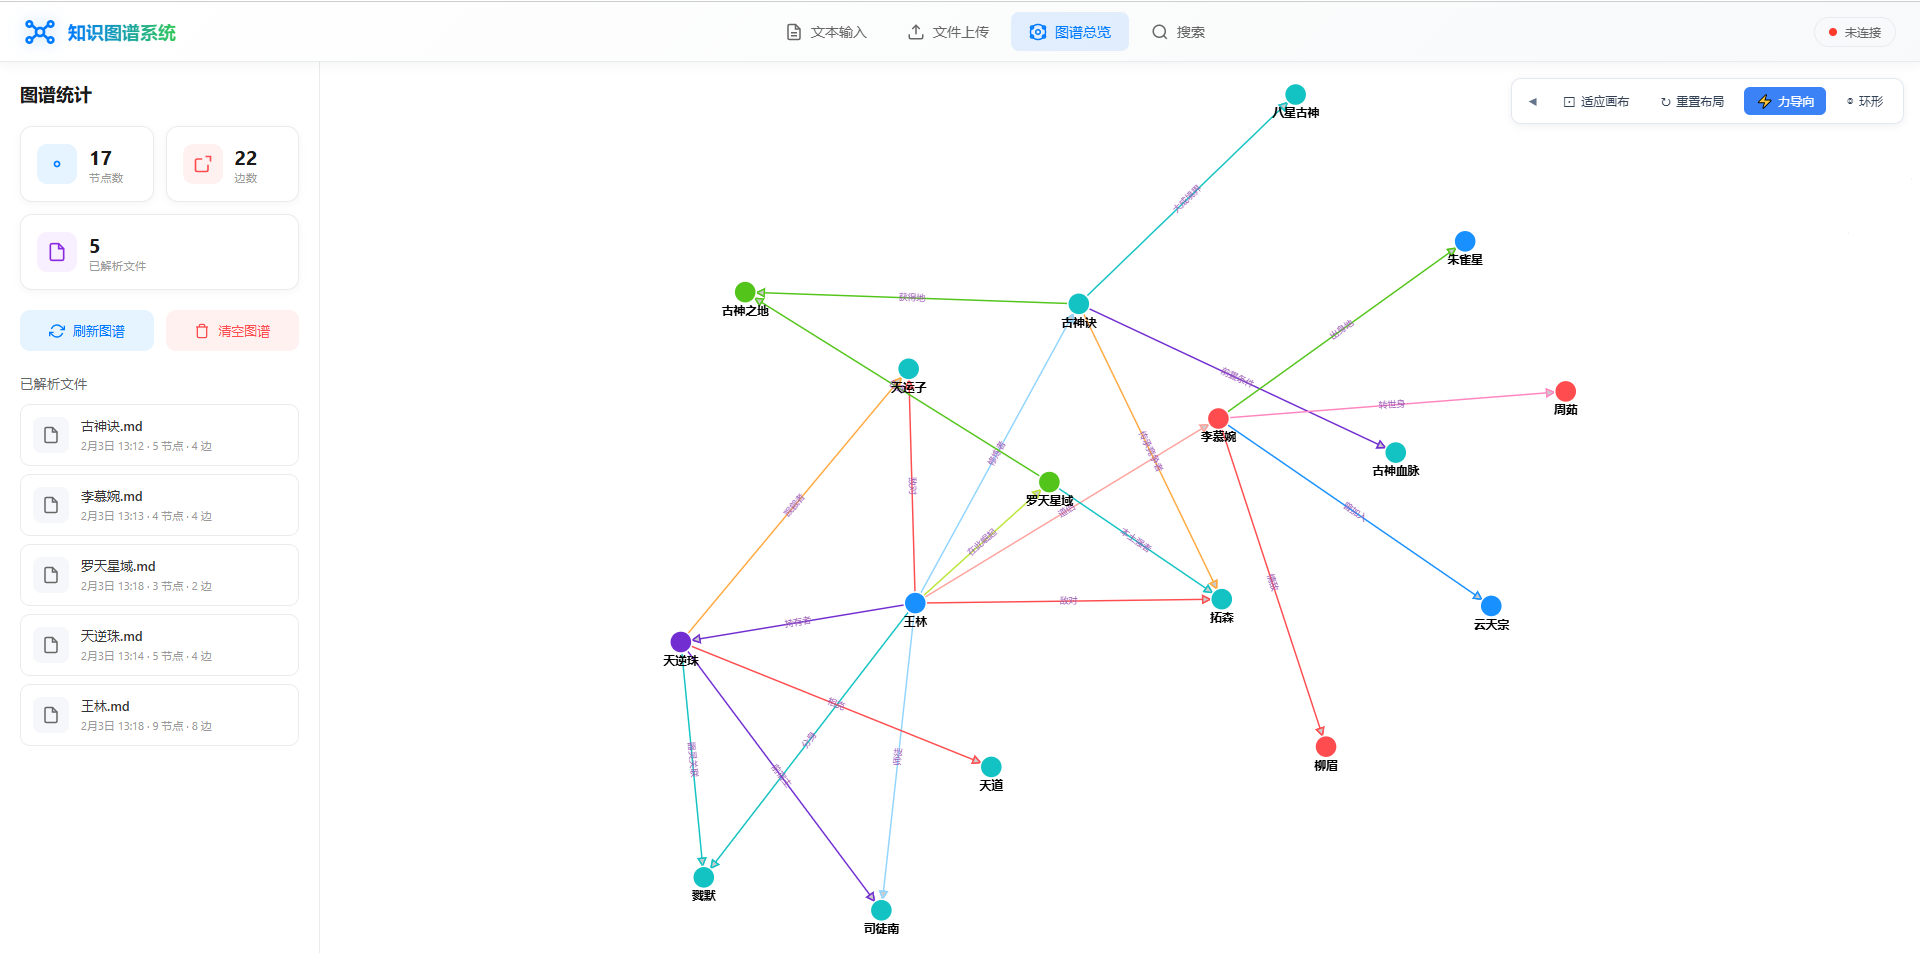
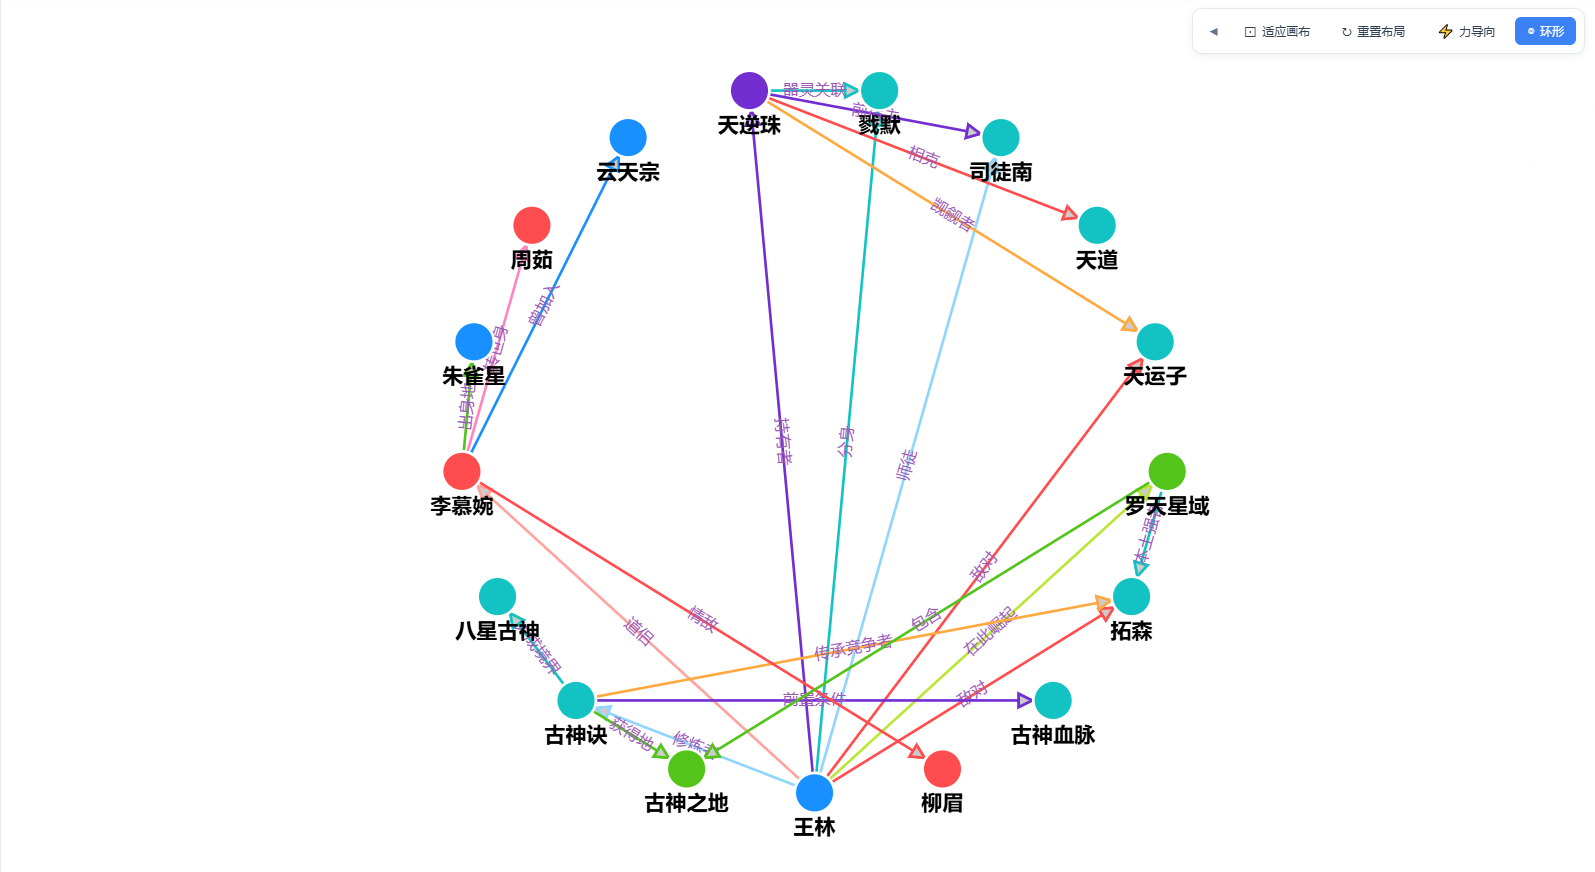
Vue 3 知识图谱可视化组件,基于 AntV G6
Maintainers
 pyznpm
Readme
pyz-knowledge-graph-vue
Vue 3 知识图谱可视化组件,基于 AntV G6。
![]()


![]()
安装
npm install pyz-knowledge-graph-vue必须引入样式
组件样式单独打包在 dist/style.css。若不引入该文件,图谱容器、工具栏(含编辑模式下左侧 GraphEditorToolbar)都会没有样式,有时还会被 G6 画布层盖住。
在应用入口(如 main.ts / main.js)增加一行:
import 'pyz-knowledge-graph-vue/dist/style.css'若使用按需引入组件,也请在任意会加载到图谱页面的入口中保证上述 CSS 至少被加载一次。
依赖
- Vue 3.2+
- @antv/g6 ^4.8.0
快速开始
<template>
  <div style="width: 100%; height: 600px;">
    <GraphVisualization
      :nodes="nodes"
      :edges="edges"
    />
  </div>
</template>

<script setup>
import { ref } from 'vue'
import { GraphVisualization } from 'pyz-knowledge-graph-vue'
import 'pyz-knowledge-graph-vue/dist/style.css'

const nodes = ref([
  { id: '1', label: '人工智能', type: '概念' },
  { id: '2', label: '机器学习', type: '概念' },
  { id: '3', label: '深度学习', type: '概念' }
])

const edges = ref([
  { source: '1', target: '2', label: '包含' },
  { source: '2', target: '3', label: '属于' }
])
</script>
组件
GraphVisualization
知识图谱可视化组件。
Props
| 属性 | 类型 | 默认值 | 说明 |
|------|------|--------|------|
| nodes | GraphNode[] | [] | 节点数据 |
| edges | GraphEdge[] | [] | 边数据 |
| width | number | 0 | 画布宽度,0 表示自适应容器 |
| height | number | 0 | 画布高度,0 表示自适应容器 |
节点数据类型 (GraphNode)
interface GraphNode {
  id: string          // 唯一标识
  label: string       // 显示文本
  type?: string       // 节点类型(用于配色)
  size?: number       // 节点大小
  style?: {
    fill?: string     // 填充色
    stroke?: string   // 边框色
    lineWidth?: number // 边框宽度
  }
  x?: number          // 初始 X 坐标
  y?: number          // 初始 Y 坐标
}
边数据类型 (GraphEdge)
interface GraphEdge {
  id: string          // 唯一标识
  source: string      // 源节点 ID
  target: string      // 目标节点 ID
  label?: string      // 关系标签
  relation_type?: string // 关系类型(用于配色)
  style?: {
    stroke?: string   // 线条颜色
    lineWidth?: number // 线条宽度
  }
}
事件 / 方法
通过 ref 调用:
<template>
  <GraphVisualization ref="graphRef" :nodes="nodes" :edges="edges" />
</template>

<script setup>
const graphRef = ref()

// 适应画布
graphRef.value?.fitView()

// 重置布局
graphRef.value?.resetLayout()

// 切换到力导向布局
graphRef.value?.switchLayout('force')

// 切换到环形布局
graphRef.value?.switchLayout('circular')

// 获取当前布局类型
const layoutType = graphRef.value?.getLayoutType()

// 聚焦到指定节点
graphRef.value?.focusNode('node-id')
</script>
GraphToolbar
图谱工具栏组件,提供布局切换、画布适应及展开/收起等功能。
Props
| 属性 | 类型 | 默认值 | 说明 |
|------|------|--------|------|
| layoutType | 'force' \| 'circular' | 'force' | 当前布局类型,用于高亮当前选中按钮 |
Events
| 事件名 | 说明 | |--------|------| | fitview | 点击"适应画布"时触发 | | resetLayout | 点击"重置布局"时触发 | | switchToForce | 切换到力导向布局时触发 | | switchToCircular | 切换到环形布局时触发 |
使用示例
<template>
  <div style="width: 100%; height: 600px; position: relative;">
    <GraphVisualization
      ref="graphRef"
      :nodes="nodes"
      :edges="edges"
    />
    <GraphToolbar
      :layoutType="layoutType"
      @fitview="graphRef?.fitView()"
      @resetLayout="graphRef?.resetLayout()"
      @switchToForce="switchLayout('force')"
      @switchToCircular="switchLayout('circular')"
    />
  </div>
</template>

<script setup>
import { ref } from 'vue'
import { GraphVisualization, GraphToolbar } from 'pyz-knowledge-graph-vue'
import 'pyz-knowledge-graph-vue/dist/style.css'

const graphRef = ref()
const layoutType = ref('force')

const switchLayout = (type) => {
  layoutType.value = type
  graphRef.value?.switchLayout(type)
}
</script>注意:工具栏支持展开/收起,点击左侧箭头按钮即可隐藏/显示工具栏按钮组。
交互功能
- 缩放画布: 鼠标滚轮
- 拖拽节点: 拖动节点可移动位置,相邻节点会跟随移动
- 拖动画布: 右键拖动
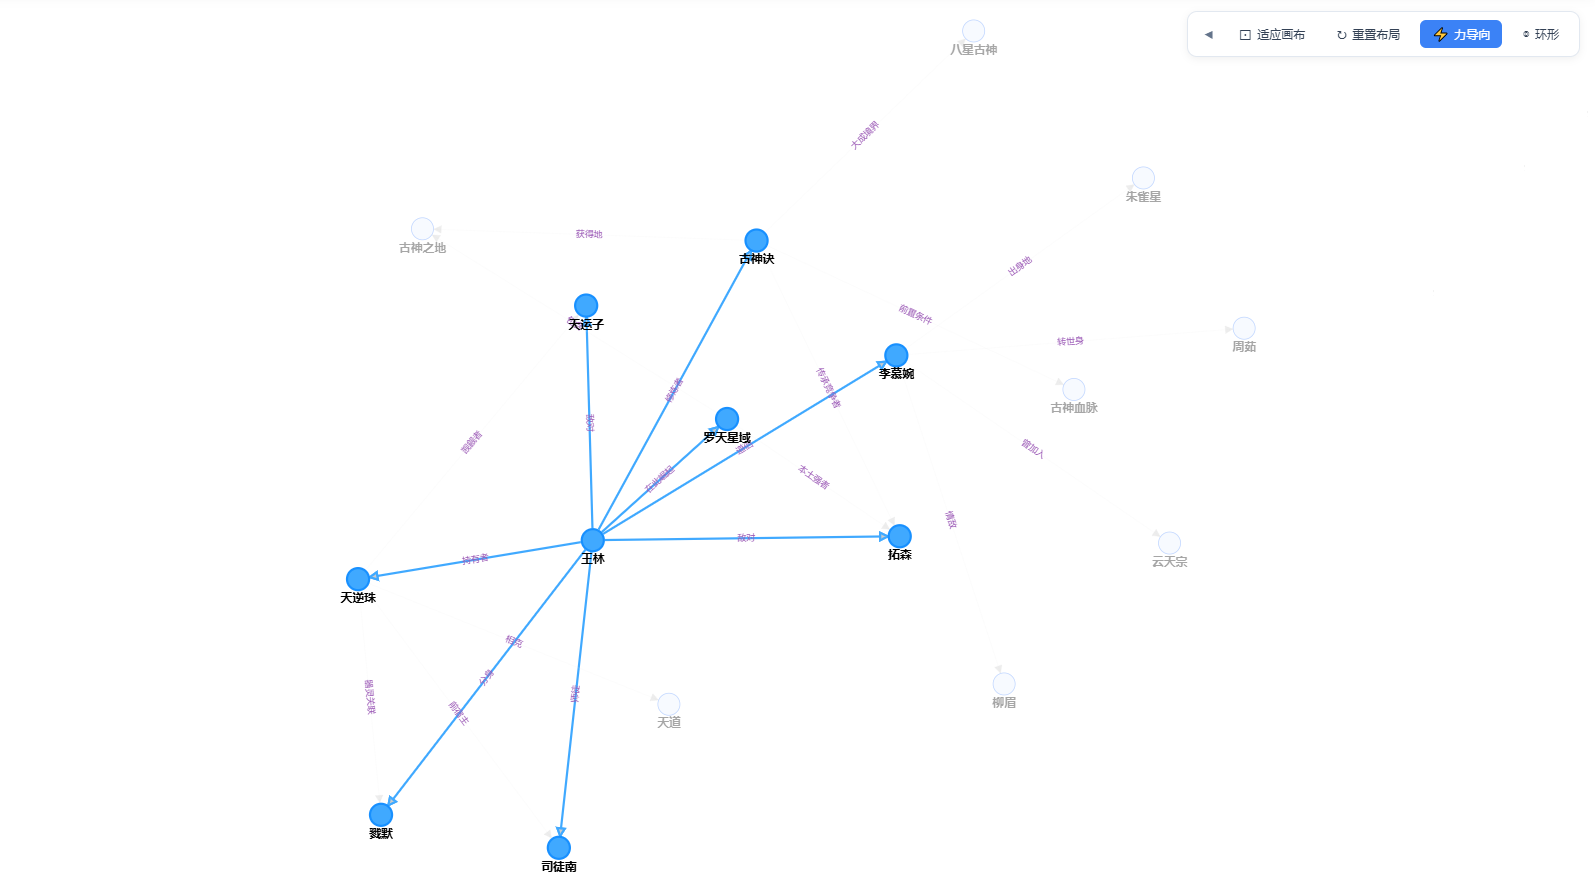
- 悬停高亮: 鼠标悬停在节点上时,相关节点和边高亮,其他节点变暗
- 点击选中: 点击节点选中并高亮相关节点,再次点击取消
- 点击空白: 点击空白处取消所有高亮
布局说明
- 力导向布局 (force): 节点自然分散,适合展示复杂关系
- 环形布局 (circular): 节点围绕中心排列,适合展示枢纽型图谱
节点/边颜色
根据类型自动配色:
节点类型颜色
| 类型 | 颜色 | |------|------| | 人物 | #ff4d4f | | 地点 | #52c41a | | 组织 | #1890ff | | 概念 | #faad14 | | 事件 | #722ed1 | | 其他 | #13c2c2 |
关系类型颜色
| 类型 | 颜色 | |------|------| | 因果 | #e74c3c | | 所属 | #2ecc71 | | 引用 | #3498db | | 相关 | #9b59b6 |
作为 Vue 插件使用
import { createApp } from 'vue'
import PyzKnowledgeGraph from 'pyz-knowledge-graph-vue'
import 'pyz-knowledge-graph-vue/dist/style.css'
import App from './App.vue'

const app = createApp(App)
app.use(PyzKnowledgeGraph)
app.mount('#div')
然后在组件中直接使用:
<template>
  <GraphVisualization :nodes="nodes" :edges="edges" />
</template>
License
MIT
作者
彭一真-别名《小游码匠》