
r-gantt-chart
v0.1.1
Published
display gantt-like vaule,like use this to order bus schedule.
Maintainers
 wuchouchou
Readme

![]()
Vue版本
Demo预览地址
Feature
- 虚拟列表,快速渲染可视区域,支持大量数据渲染
- 可变时间轴,1 分钟,2 分钟,3 分钟,4 分钟~~~到一天
- 可变单元格
- 标记线
- 支持自定义描述和容器块
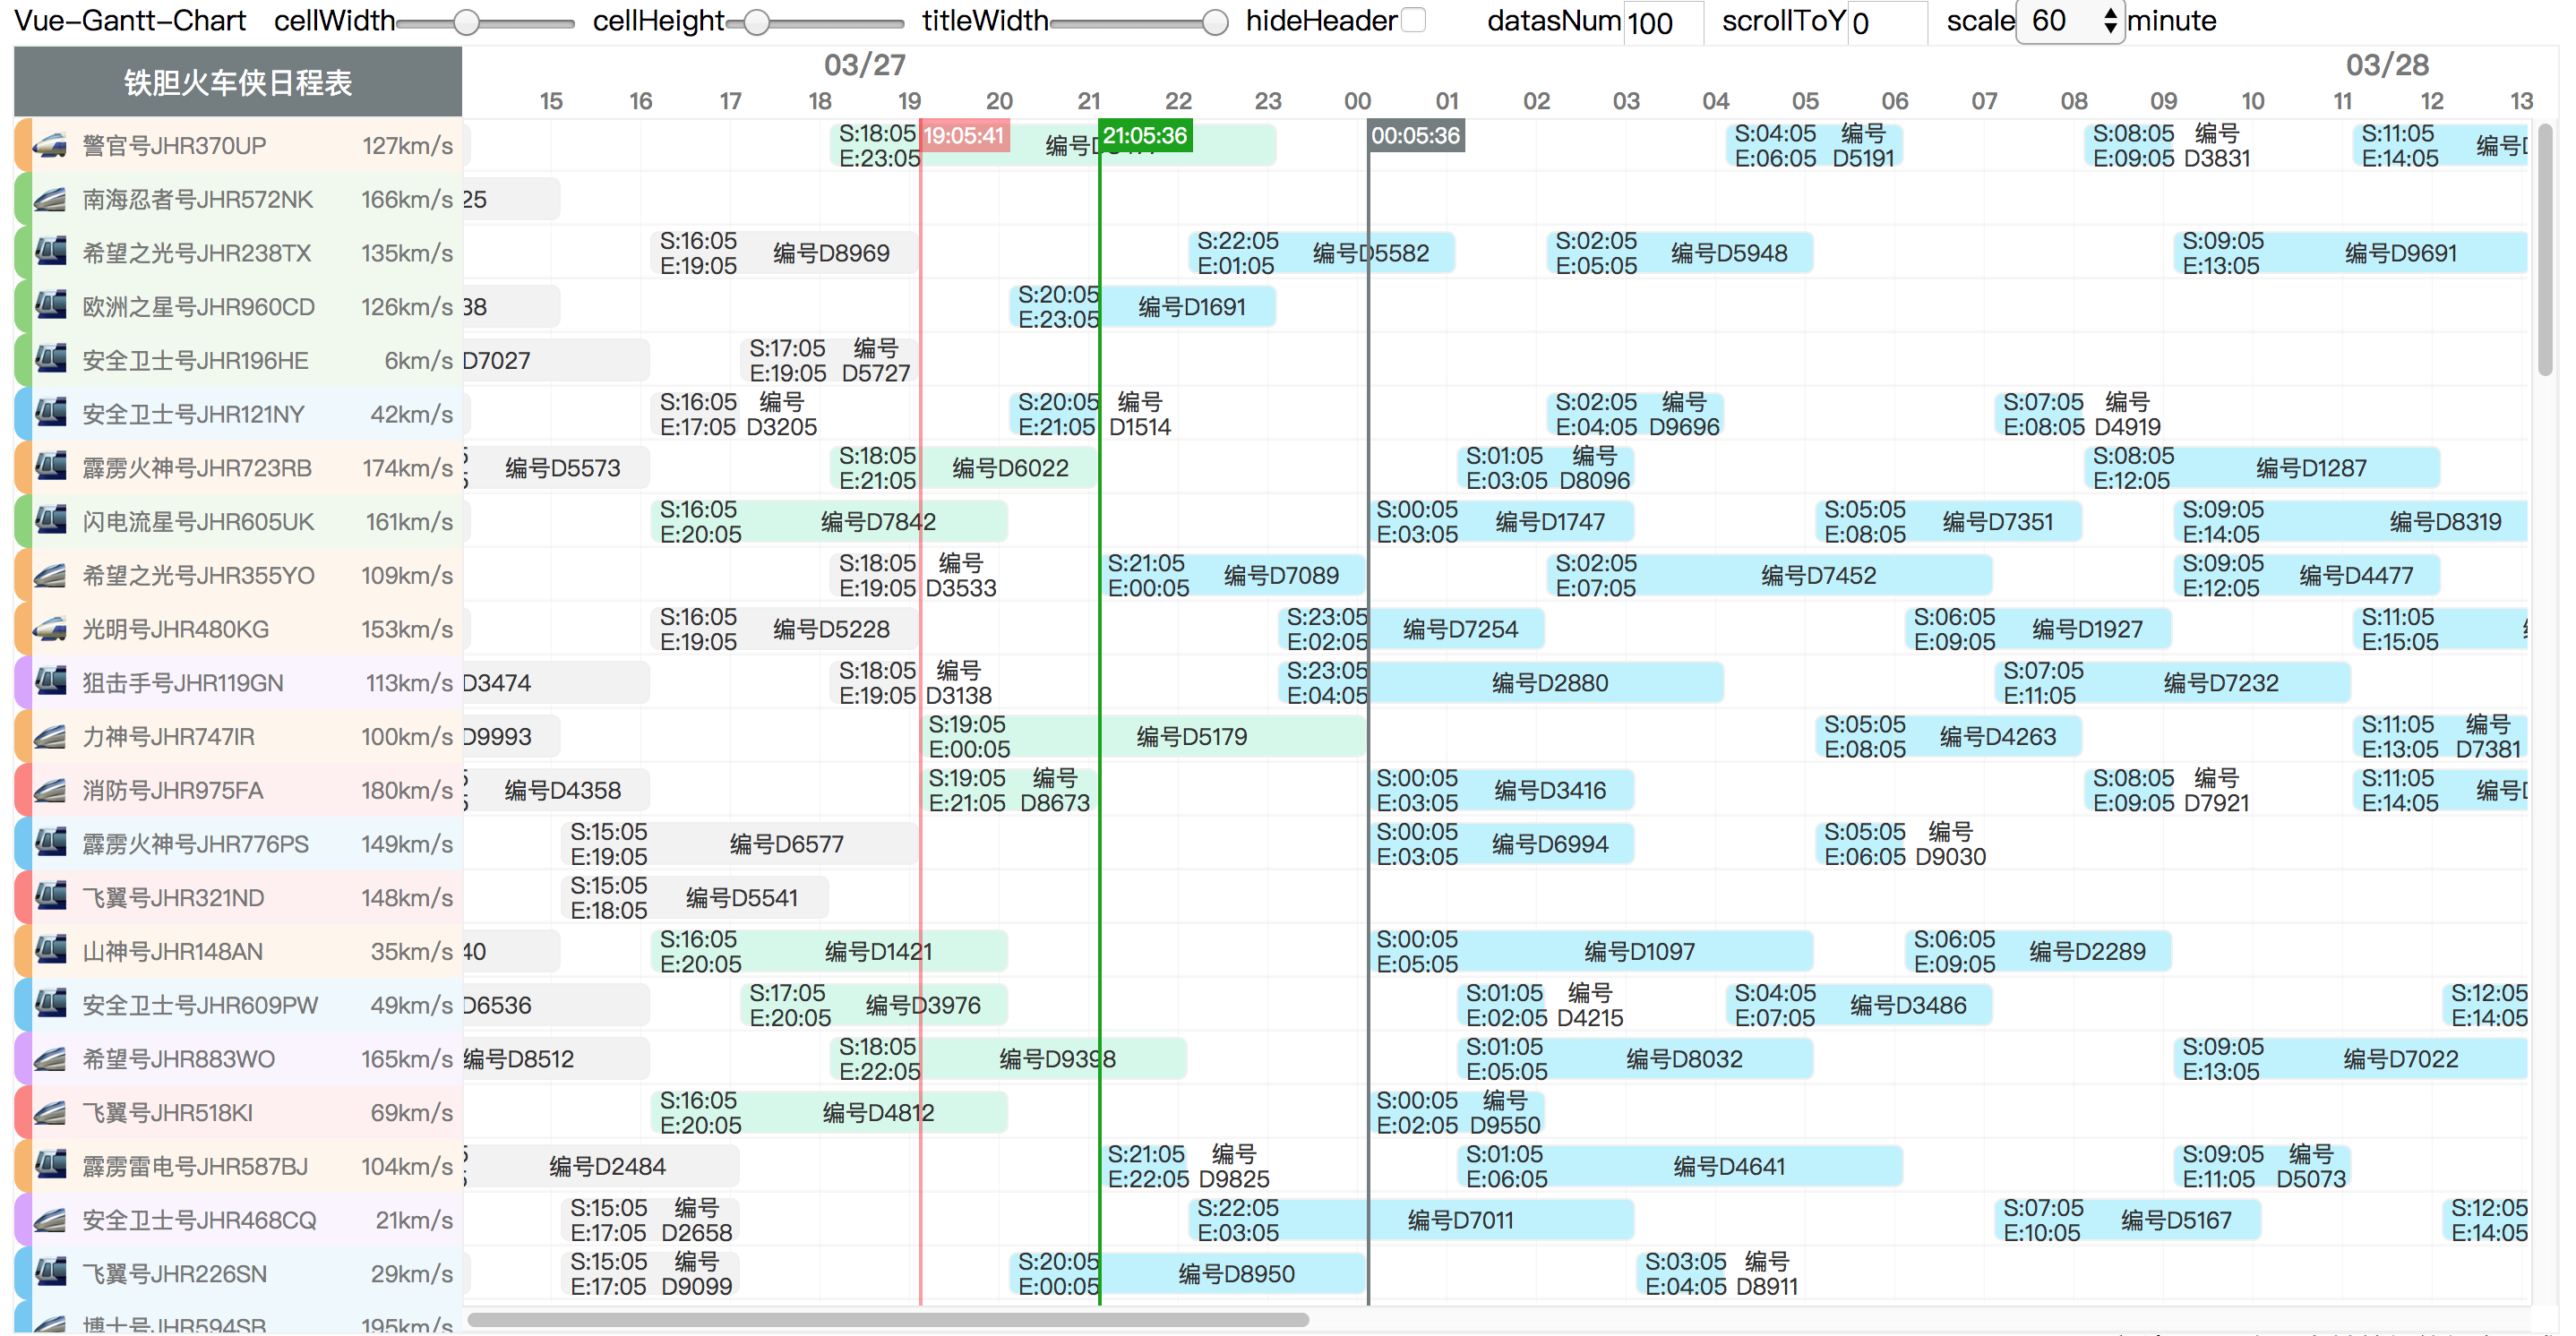
Screenshot
Install

npm i r-gantt-chart --saveUse
template code
import * as React from 'react';
import * as ReactDOM from 'react-dom';

import Gantt from 'r-gantt-chart'; // 引入组件
import dayjs from 'dayjs'

import TestLeft from './components/test-left.jsx' // 你的左侧组件
import TestBlock from './components/test-block.jsx' // 你的右侧组件

const  mockDatas =[
  {
    id:'test',
    name:'sala',
    gtArray:[
      {
        name:'test',
        start:'2019-01-11 18:18:18',
        end:'2019-01-11 18:18:18'
        //...
      }
    ],
    //...
  }
  //...
]

function TestLeft(data){
  return (
    <div class="myleftblock">{data.name}</div>
  )
}

function TestBlock(data,item){
  return (
    <div class="myblock">{item.name}</div>
  )
}

function wrapTestBlock(data,
                      getPositonOffset,
                      getWidthAbout2Times,
                      isInRenderingTimeRange,
                      startTimeOfRenderArea,
                      endTimeOfRenderArea){
// `getPositonOffset(time:string):number `
// 定位函数,根据给定字符串形式的时间生成相对时间轴起点的的偏移值

// `getWidthAbout2Times(start:string,end:string):number`
// 为宽度计算函数,根据给定字符串形式的时间计算两个时间差的宽度值

// `isInRenderingTimeRange(time:string):boolean`
// 判定给定的时间是否在屏幕显示的时间轴范围之内

// startTimeOfRenderArea 屏幕当前显示范围的开始时间的毫秒数

// endTimeOfRenderArea 屏幕当前显示范围的结束时间的毫秒数

  return data.gtArray.map(item=>{
    if(isInRenderingTimeRange(item.start)||isInRenderingTimeRange(item.end)){
      return(
        <div className="yourBlockContainer"
        key={item.id}
        style={{position: `absolute`,
                left:getPositonOffset(item.start)+'px',
                width:getWidthAbout2Times(item.start,item.end)+'px'}}>
          {TestBlock(data,item)}
        </div>
      )
    }
    return  null
  })
}
function MyHeader(){
  return (
    <div>react-gantt-chart</div>
  )
}

ReactDOM.render(
  <div style={{ height: `100vh`, width: '100vw' }}>
    <Gantt datas={mockDatas}
        dataKey={"id"} // 最好传递key值,不然可能会出现闪动
        startTime={dayjs().toString()}
        endTime={dayjs().add(2, "day").toString()}
        //render props
        renderLeftBar={TestLeft}
        renderBlock={wrapTestBlock}
        renderHeader={MyHeader}/>
  </div>
  ,
  document.getElementById('root') as HTMLElement
);
API
Param
| param | required | type | default | describe |
| :-------------- | :------: | :-----: | :----: | :---- |
| startTime | ❌ | string | 当前时间 | 时间轴开始时间,需为合法的时间字符串,如:2019-01-11 18:18:18|
| endTime | ❌ | string | 当前时间 | 时间轴结束时间,需为合法的时间字符串,如:2019-01-11 18:18:18|
| cellWidth | ❌ | number | 50 | 时间区间的宽度 |
| cellHeight | ❌ | number | 20 | 时间区间的高度 |
| titleHeight | ❌ | number | 40 | 表头的高度 |
| titleWidth | ❌ | number | 200 | 表头和行的宽度 |
| scale | ❌ | number | 60 | 时间轴的刻度值。单位:分钟,允许值[1, 2, 3, 4, 5, 6, 10, 12, 15, 20, 30, 60, 120,180,240,360, 720, 1440] |
| datas | ❌ | array | [] | 需要渲染的数据 |
| dataKey | ❌ | string | -- | 渲染的每一行的key ,最好传递,否则可能出现闪动 |
| showCurrentTime | ❌ | boolean | false | 显示当前时间,每秒钟更新 |
| timelines | ❌ | array | -- | 显示标记时间,有特殊格式 [{time:'2019-01-11 18:18:18',color:'#00000'}] |
| hideHeader | ❌ | boolean | false | 隐藏时间轴和表头 |
| hideXScrollBar | ❌ | boolean | false | 隐藏横向滚动轴 |
| hideYScrollBar | ❌ | boolean | false | 隐藏纵向滚动轴 |
Caution
IE 需要自己处理一些ployfill
License
MIT ©wuchouchou