
react-debugger-extension
v3.0.0
Published
React debugging in Chrome DevTools — a 5-view panel (Dashboard, Profiler, State, Effects, Settings) with render/memory profiling, issue detectors, a Redux inspector, AI analysis, and an MCP server for coding agents.

Maintainers
 nhonh
nhonhReadme
React Debugger — Chrome DevTools Extension






The only Chrome extension that unifies React Timeline + Performance + Memory + Side Effects + Redux + CLS + AI analysis into a single DevTools tab — zero install in your app.
Extension version: 3.0.0 · CLI version: 2.1.2 · Author: NhoNH · License: MIT
⚡ Try it in 30 seconds
npx @nhonh/react-debugger@latestThen load the built extension as unpacked in chrome://extensions. Chrome Web Store listing coming soon — npx is the fastest path today.
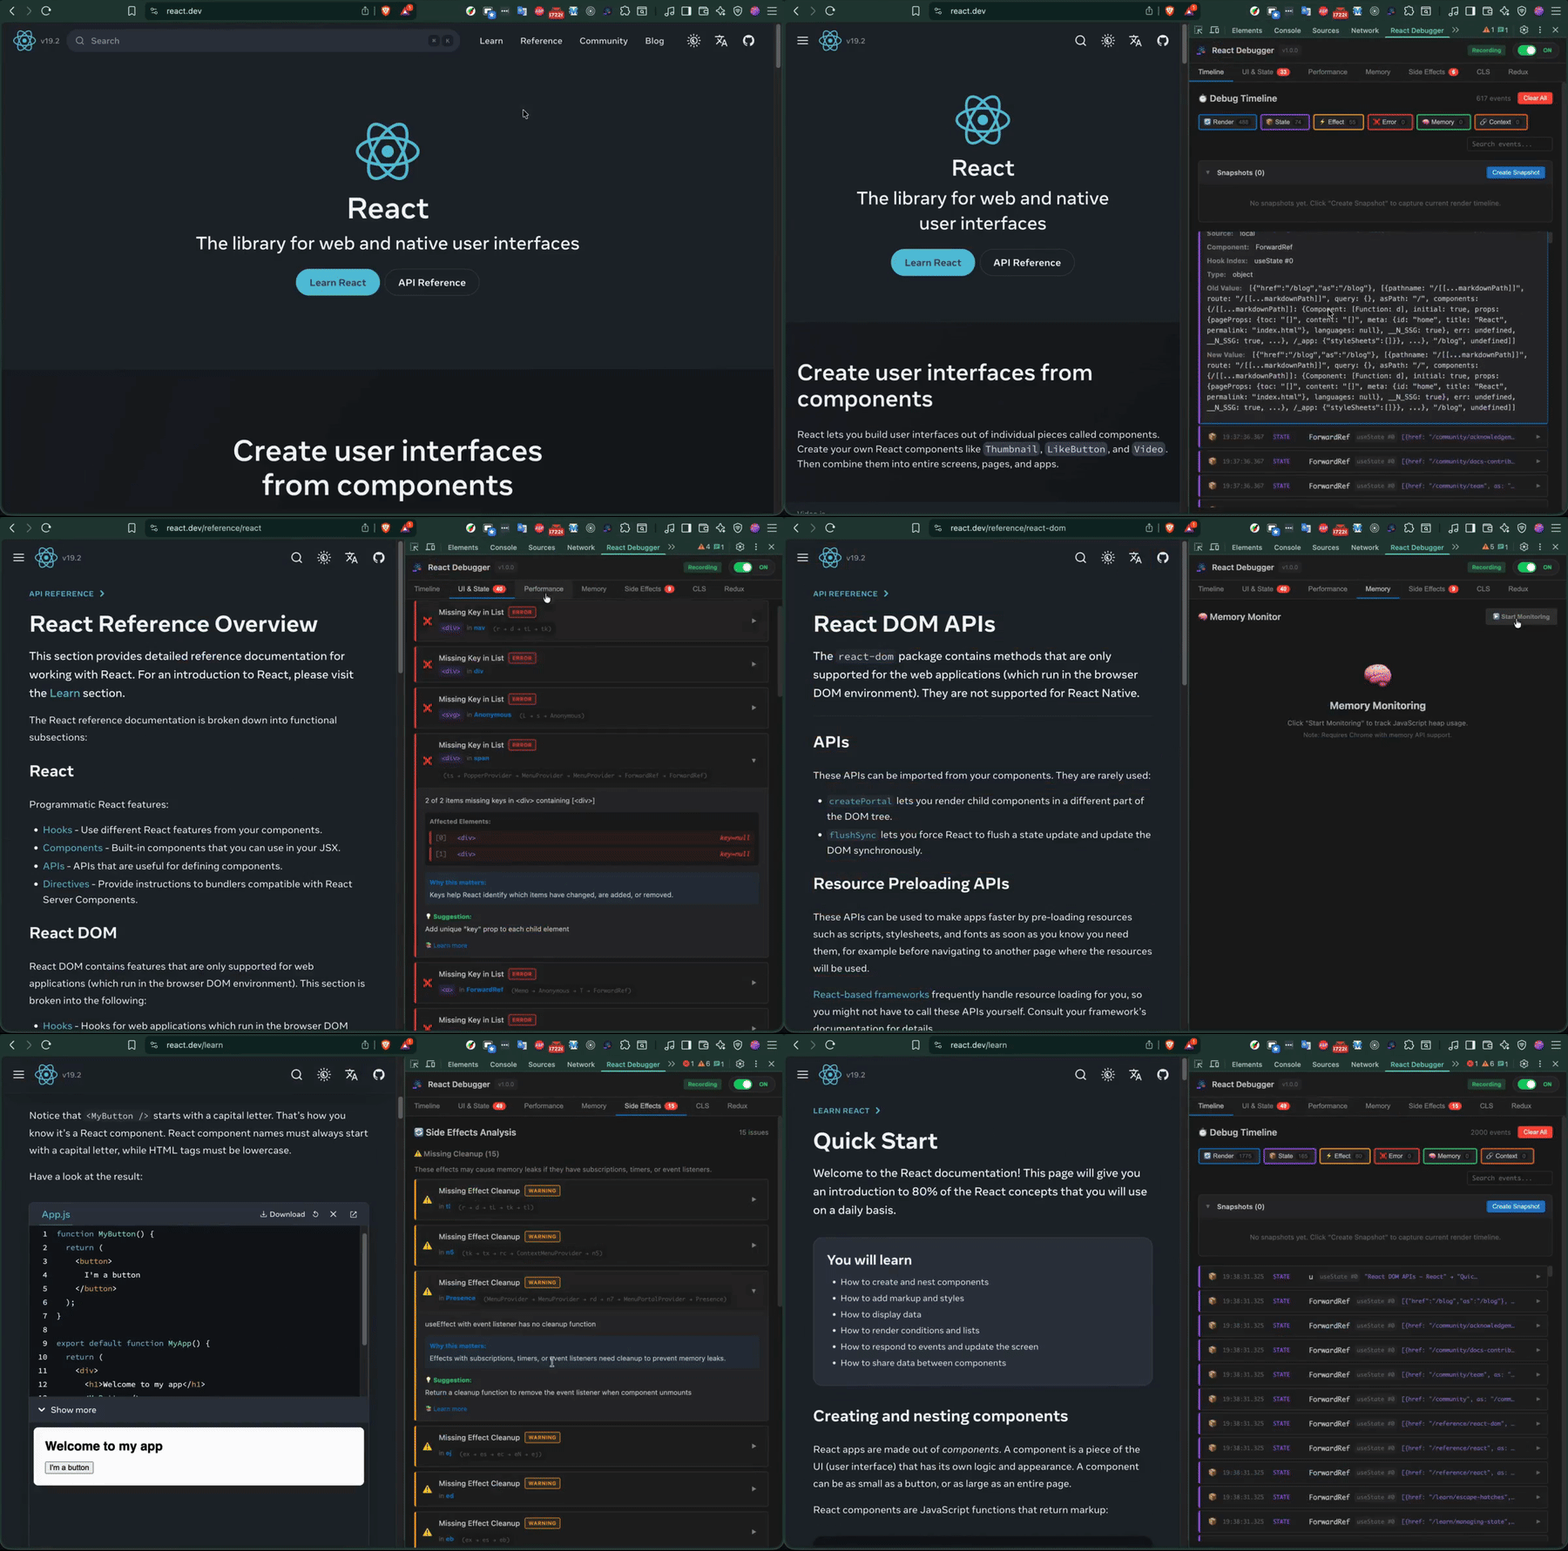
Demo
Why this extension
If you debug React apps in production today, you're probably switching between four tools to chase one bug:
- React DevTools — component tree, but no timeline, no CLS, no memory leak detection
- Chrome Performance tab — renders, but no React context
- Redux DevTools — state, but isolated from render cycle
- react-scan — great render overlay, but requires app-code changes; no Redux, no CLS, no memory
- why-did-you-render — precise render logs, but console-only and needs Babel config
React Debugger unifies all of this into a single DevTools tab — zero code changes in your app, with seven analyzers and an optional AI layer for security/perf/crash insight.
The defensible triple-lock no competitor combines: CLS overlay + useEffect audit + AI analysis, all in one zero-install browser panel.
Features
| Tab | What it does |
|---|---|
| Timeline | Visual history of every render, state change, effect, and error |
| UI & State | Detects direct state mutation, missing keys, index as key, stale closures |
| Performance | Render counts, render reasons (props/state/context), Core Web Vitals overlay |
| Memory | Heap-size sparkline, growth-rate alerts, leak-detection heuristics |
| Side Effects | useEffect auditor: missing cleanups, bad dependency arrays |
| CLS | Real-time Cumulative Layout Shift score + per-element attribution |
| Redux | State tree, action history, manual action dispatch (no separate Redux DevTools needed) |
| AI Analysis | LLM-powered security, performance, and crash-risk scan. 3 free analyses per session; unlimited with a subscription key. Requires no API key from you. |
Screenshots
| Timeline | Performance |
|---|---|
|  |
|  |
|
| Memory | Side Effects |
|---|---|
|  |
|  |
|
| CLS | Redux |
|---|---|
|  |
|  |
|
How it compares
| Feature | React Debugger | react-devtools | react-scan | why-did-you-render | redux-devtools |
|---|:---:|:---:|:---:|:---:|:---:|
| Render timeline (ambient) | ✅ | ⚠️ (manual record) | ⚠️ overlay only | ❌ | ❌ |
| Render reasons (prop/state diff) | ✅ | ⚠️ (no values) | ✅ | ✅ console | ❌ |
| Memory leak detection | ✅ | ❌ | ❌ | ❌ | ❌ |
| useEffect audit | ✅ | ❌ | ❌ | ❌ | ❌ |
| Redux integrated | ✅ | ❌ | ❌ | ⚠️ | ✅ time-travel |
| CLS overlay | ✅ | ❌ | ❌ | ❌ | ❌ |
| AI analysis | ✅ | ❌ | ❌ | ❌ | ❌ |
| Install method | Chrome extension (no app changes) | Chrome extension | npm/script tag (app code) | npm + Babel | Chrome extension |
Bold rows = features no other tool combines into one panel.
Recent release: v3.0.0 — DevTools-native redesign + 8 new detectors
The biggest release since launch — a full UI redesign, eight new issue detectors, an MCP server, and BYOK AI:
- DevTools-native UI redesign. The 9 legacy tabs consolidate into a focused 5-view shell — Dashboard / Profiler / State / Effects / Settings — with an active-underline nav, per-view count badges, segmented sub-tabs, and a sticky header. The classic 9-tab layout stays one toggle away.
- New Dashboard. A first-screen overview: severity KPI stat-tiles, React version/mode + Redux chip, a render-pressure sparkline, top-offender components, and page-load vitals.
- Charts. A dependency-free
ChartCanvas(area / line / bars + faint grid + emphasized endpoint) powers the Memory heap-over-time timeline and the Performance render-distribution. - 8 new detectors on a pluggable registry (per-detector Settings toggles + confidence badges): 4 hero — unstable list keys, hydration mismatch, context cascade, suspense waterfall — plus stale-closure-async, inline-handler-cost, and ref-mutation-during-render.
- MCP server for LLM coding agents (stdio bridge + token/Origin pairing) and BYOK AI providers (HostedProxy / OpenAI / Anthropic / none), with opt-in anonymous telemetry (default off).
- Accessibility & quality. WCAG 2.1 AA contrast,
prefers-reduced-motion, focus-visible rings, and a headless Playwright visual-regression lane.
See CHANGELOG.md for the full history (including the v2.0.3 zero-lag performance work this builds on).
Installation
Option 1 — Quick install via npx (recommended)
npx @nhonh/react-debuggerThis downloads and extracts the latest extension build to your current directory. Then load it in Chrome:
- Open
chrome://extensions/ - Enable Developer mode (top right)
- Click Load unpacked
- Select the extracted folder
Option 2 — Build from source
You need Node 20+ and Chrome 122+.
git clone https://github.com/hoainho/react-debugger-extension.git
cd react-debugger-extension
npm ci
npm run build
Then load the dist/ folder in Chrome via the same chrome://extensions/ → Load unpacked flow.
Option 3 — Download ZIP from Releases
- Grab
react-debugger.zipfrom GitHub Releases - Extract and load via
chrome://extensions/→ Load unpacked
Quick Start
- Open any React 16+ application
- Press
F12(orCmd+Option+I/Ctrl+Shift+I) - Find the "React Debugger" tab in the DevTools panel strip
- The extension auto-detects React and starts collecting data immediately
For detailed walkthroughs of each tab, debugging strategies by skill level, and threshold reference tables, see DEBUGGING-GUIDE.md.
For 50 documented edge cases across 6 categories (Initialization, Performance Monitoring, Redux Integration, Memory & Cleanup, UI & State, CLS & Layout), see EDGE-CASES.md.
Comparison
| | React Debugger | React DevTools | why-did-you-render | react-scan | |---|:---:|:---:|:---:|:---:| | Component tree | partial | ✅ | — | ✅ | | Render tracking | ✅ | ✅ profiler | ✅ | ✅ | | Memory profile | ✅ | — | — | — | | Side-effect audit | ✅ | — | partial | — | | Redux state | ✅ | — | — | — | | CLS monitoring | ✅ | — | — | — | | AI analysis | ✅ | — | — | — | | In-DevTools panel | ✅ | ✅ | — | — |
The wedge: React Debugger is the only Chrome DevTools panel that combines all seven analyzers in one tab.
Development
npm ci                  # one-time install
npm run dev             # rebuild on change (watch mode)
npm run build           # production build → dist/
npm run test:run        # one-shot Vitest run
npm run package         # build + zip → react-debugger.zip
After every rebuild during dev, click the refresh icon on the extension card at chrome://extensions/ and reload the inspected page.
Project structure
react-debugger-extension/
├── src/
│   ├── background/      # Service worker
│   ├── content/         # Content script (CLS monitoring)
│   ├── inject/          # Page script (React fiber hook, bippy-aligned)
│   ├── devtools/        # DevTools page entry
│   ├── panel/
│   │   ├── components/  # Reusable components
│   │   ├── tabs/        # 8 tab components incl. AI Analysis
│   │   └── styles/      # CSS (with prefers-reduced-motion support)
│   ├── services/        # AI client, token optimizer, snapshot builder
│   ├── types/           # TypeScript types
│   ├── utils/           # Utilities (sanitize, messaging)
│   └── __tests__/       # Vitest unit tests (170 tests across 9 files)
├── cli/                 # @nhonh/react-debugger npm package
├── worker/              # Cloudflare Worker (AI subscription key validation)
├── test/
│   └── fixtures/basic/  # E2E fixture app for Playwright (Vite + React 18)
├── docs/                # Landing page (hoainho.github.io/react-debugger-extension)
└── openspec/            # In-flight design proposals (growth campaign, MCP server v1)
Troubleshooting
Extension doesn't show in DevTools
- Verify you loaded the
dist/folder, not the repo root - Reload the inspected page after loading the extension
- Check
chrome://extensions/for errors
React not detected
- The page must use React 16+ with the Fiber architecture
- Refresh the page — content script attaches at
document_start - Check the console for errors from the extension
- React must be in development mode for some features (e.g., render reasons)
No issues detected
- The extension only surfaces issues when found — a quiet panel is a healthy app
- Try the examples in DEBUGGING-GUIDE.md
Performance regression on the host page
v2.0.3 specifically targeted host-page lag. If you still see it, please open a bug with Chrome version, extension version, and the inspected page URL.
Contributing
We welcome contributions of all sizes. The fastest way in:
- Browse good-first-issue items — each one has scope, file pointers, and acceptance criteria
- Claim with a comment:
@hoainho I'll take this - Read CONTRIBUTING.md for local setup, conventional commits, and the PR review SLA
We also have help wanted items for larger contributions.
Community
- 💬 GitHub Discussions — questions, ideas, show-and-tell. Five categories with structured templates: Q&A, Ideas, Show & Tell, General, Announcements.
- 📚 Wiki — living docs: architecture overview, FAQ, debugging cookbook, glossary
- 🐛 Issues — bug reports, feature requests
- 🔒 Security policy — responsible disclosure (90-day timeline)
- 📜 Code of Conduct — Contributor Covenant v2.1
What's Next
Active design work lives in openspec/changes/:
mcp-server-v1/— adding a Model Context Protocol server so LLM coding agents (Claude Desktop, opencode, Cursor) can drive the extension's debugging tools programmatically. Currently in spec phase; first contributor PRs are already landing scaffolding.growth-and-contributor-attraction/— 90-day plan to grow the project and contributor base. Week 1 (license + on-ramp) shipped May 2026.
⭐ If this saves you time, please star the repo
Every star helps more React developers discover the project — and it's the single most useful signal you can send the maintainer that the work matters. One click. Big difference.
You can also 👀 Watch releases to get notified when new tabs (or the MCP server) ship.
License
MIT — Copyright © 2025-2026 NhoNH.
React and the React logo are trademarks of Meta Platforms, Inc. This extension is not affiliated with or endorsed by Meta or the React team.