
react-geo-charts
v1.0.7
Published
A simple react worldmap and countrymaps component svg base
Downloads
41
Maintainers
 jptechinsight
Readme
react-geo-charts
![]()
You're looking for an SVG-based React map that supports:
- World-level view with countries
- Drill-down to states/provinces (geo-regions)
- Interactive selection and custom metadata
- Custom styling (color, CSS, tooltip, etc.) etc...
Install
npm i react-geo-chartsUsage
import React from 'react';
import WorldSVGMap, { dataSet } from "react-geo-charts"
import "./App.css"
const type = {
"Continent": "Continent",
"1": "1"
}
function App() {
const [regioncode, setregioncode] = React.useState("US")
const [code, setcode] = React.useState([])
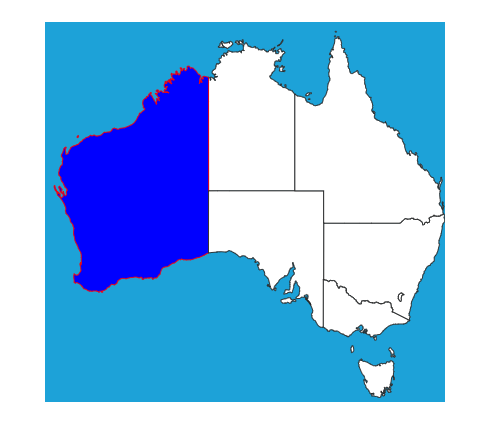
const customizeFuncation = () => {
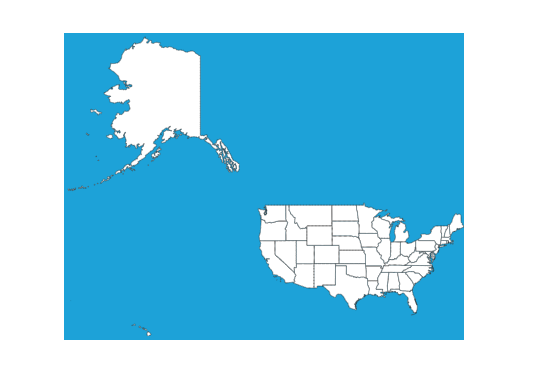
let customizeData = {}, data = dataSet.US; // find in dataset as regioncode
for (let key in data) {
customizeData[key] = {
fill: code.includes(key) ? "blue" : "#fff",
stroke: code.includes(key) ? "red" : "#222",
identifierdata: data[key] + "100%",
regiontooltipdisable: key == "AK", // Alaska
disable: key == "AK", // Alaska
onClick: (ISOIdentifier) => {
setcode(code.includes(ISOIdentifier) ? code.filter(e => e != ISOIdentifier) : [...code, ISOIdentifier])
}
}
}
return customizeData
}
return (
<div className="App">
<WorldSVGMap
regioncode={regioncode}
containerClass=""
width="100%"
height="100%"
filldefault="#ccc"
strokedefault="#222"
customize={customizeFuncation()}
figure={type[1]} // for continent use like type.Continent
tooltipdisable={true}
/>
</div>
);
}
export default App;
ReactDOM.render(<App/>, document.body)list of props
| Prop | Description | Type | Default |
| ----------------- | -------------------------------------------------------------- | ------------------ | ----------------- |
| regioncode | options for regioncode: countries:[US, IN, AU, CA] with variant US1, IN1 'worldmap',continent:[AF,AS,EU,NA,OC,SA] | String | "" |
| width | width option for svg tag | String | 100% |
| height | height option for svg tag | String | 100% |
| filldefault | region fill default color | String | #fff |
| strokedefault | region stroke(border) default color | String | #222 |
| viewBox | set to svg tag viewBox attribute | String | according to map |
| figure | use for variant and continent type map as you can see in example | String | "" |
| tooltipdisable | use for all regions with tooltips disabled. | Bool | false |
| customize | customize option | Object | '{}' |
| identifierdata | customize the option in the set ‘identifierdata’ as a tooltip. | String | 'worldmap' and 'continentmap' in country or 'countrymap' in state,provinces |
| regiontooltipdisable | customize the option in the set ‘regiontooltipdisable’ as tooltip disable for a specific region. you can see in the example. | Bool | false |
| disable | Customize the option in the set 'disable' to a specific region. you can see in example | Bool | false |
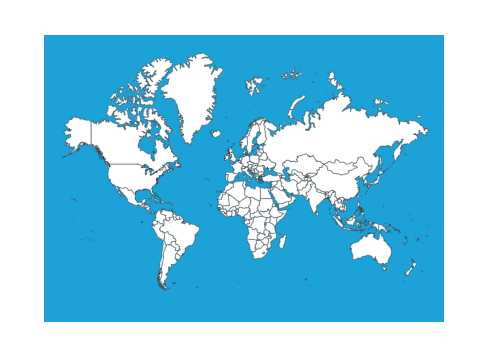
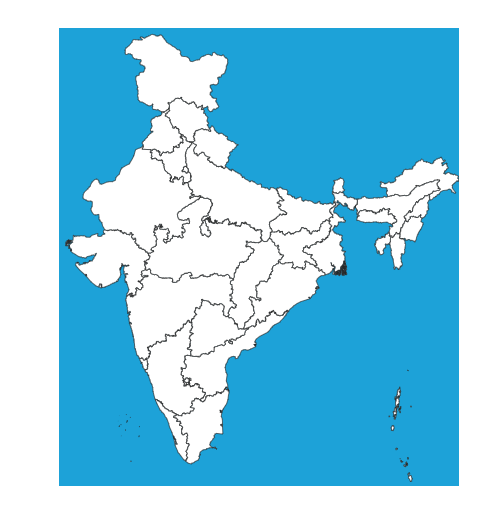
Maps
License
MIT.
Copyright (c) 2025 Jeel Chheta