
react-native-funnel-graph
v1.0.6
Published
A flexible, SVG-based funnel chart component for React Native to visualize sequential data and conversion rates.
Maintainers
 abhishekml
Keywords
Readme
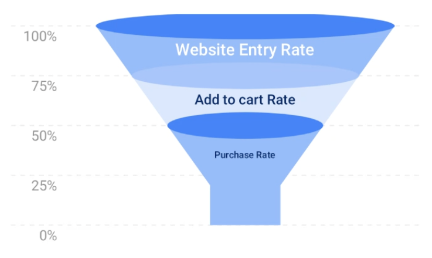
react-native-funnel-graph 📊

![]()
A high-performance SVG funnel chart component for React Native with beautiful gradients and automatic percentage labels.
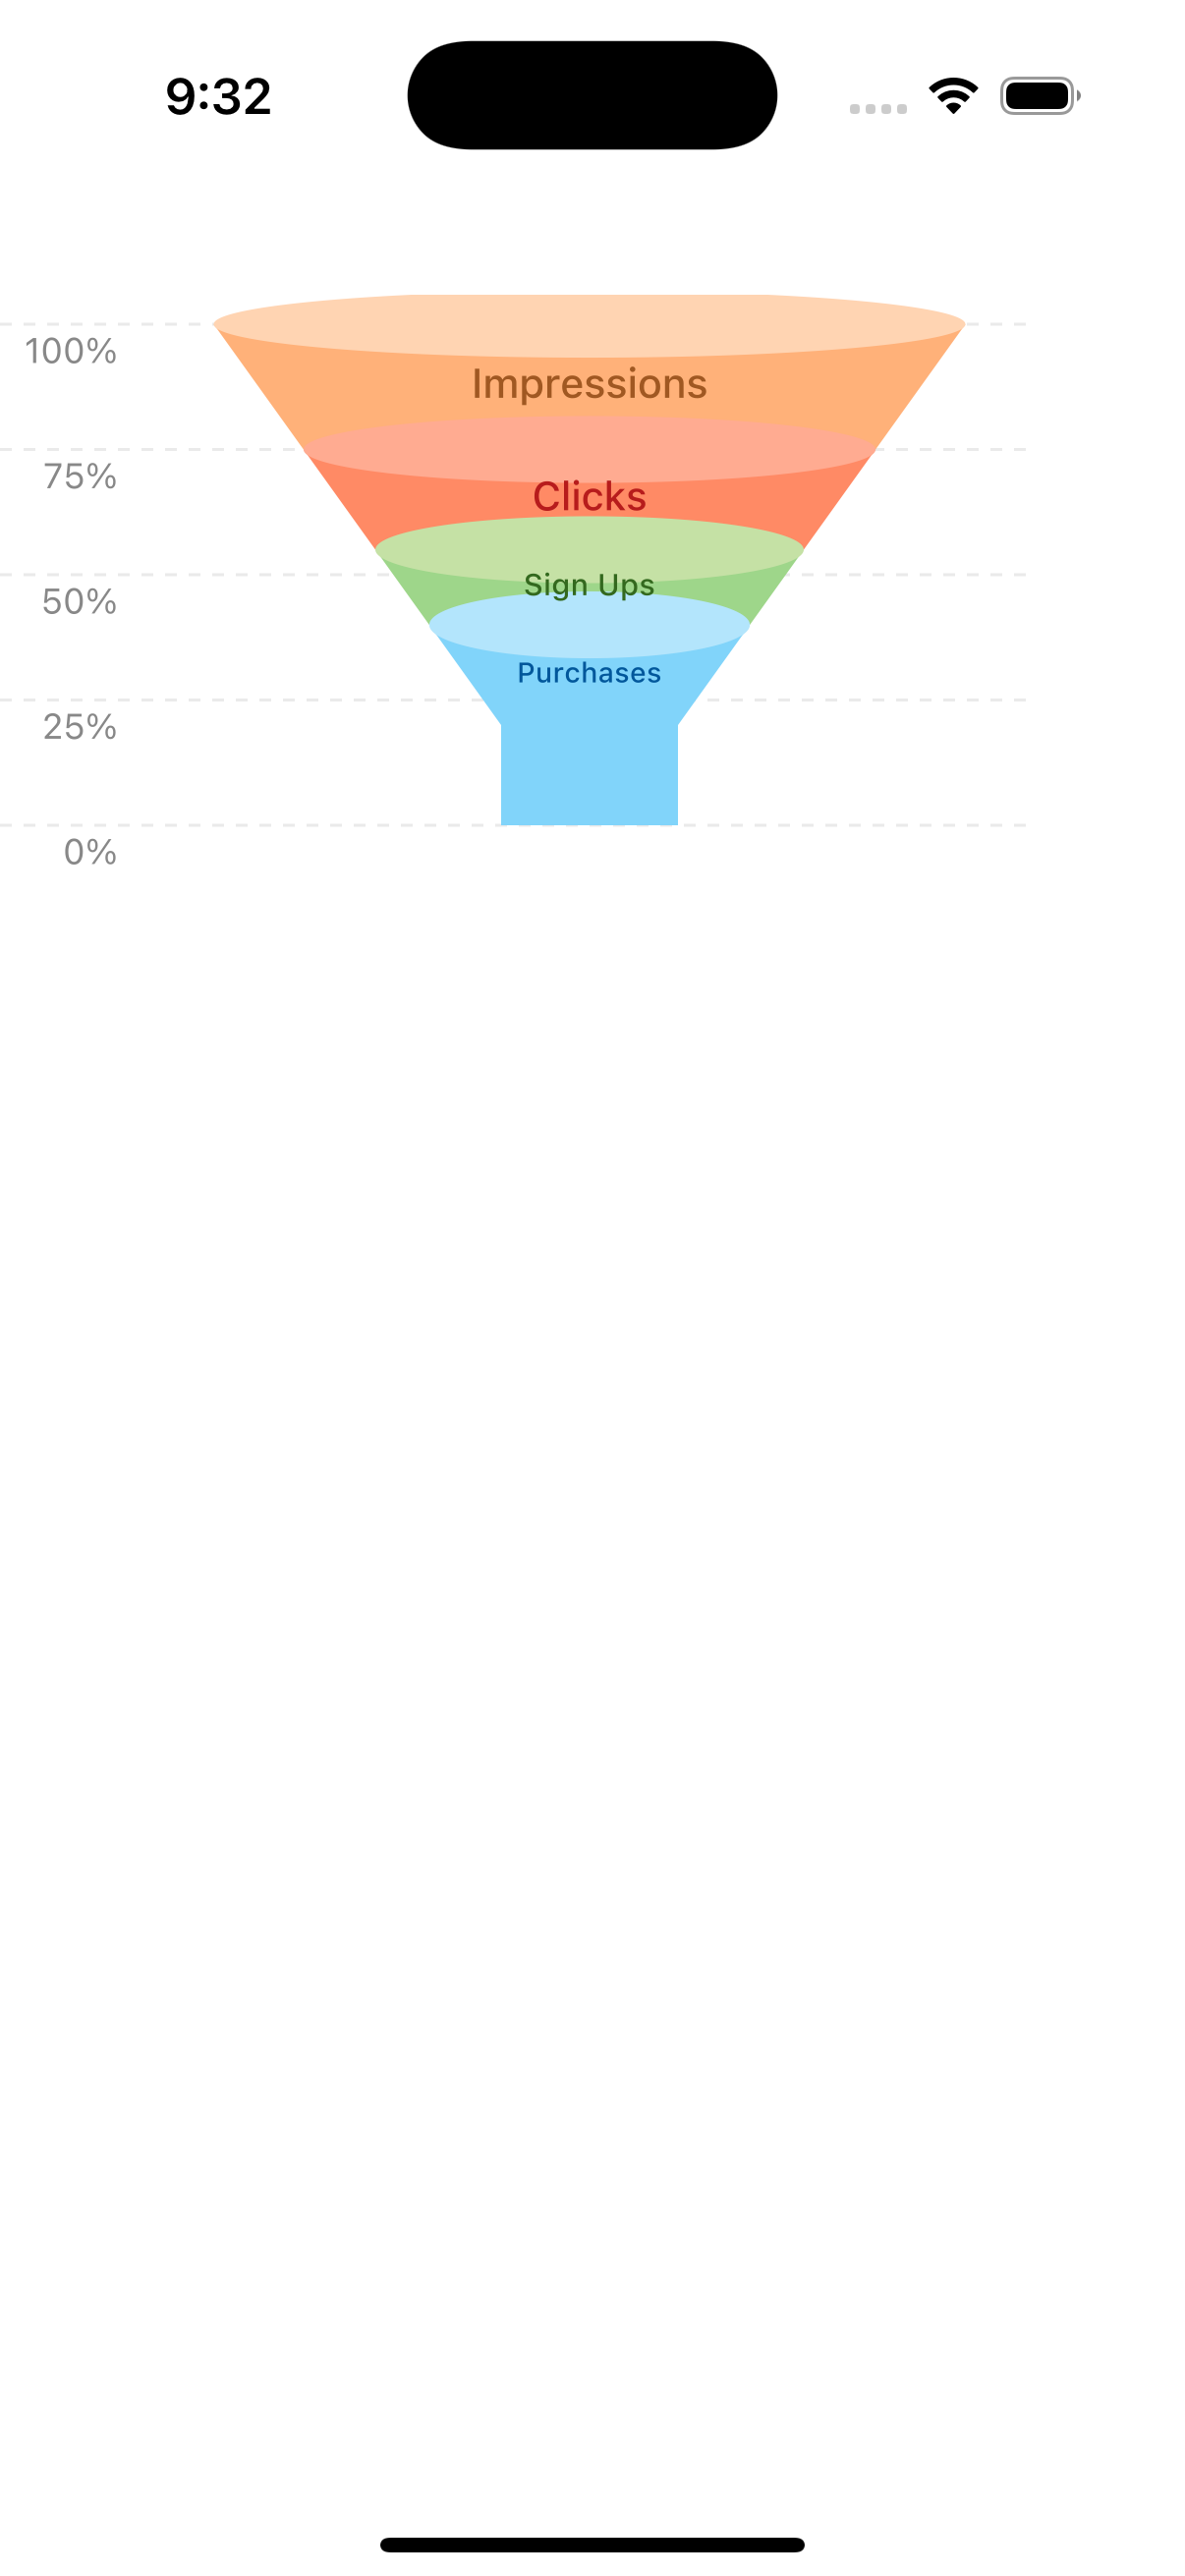
Example
Features ✨
- Beautiful Defaults: Comes with a sleek, blue gradient theme out of the box.
- Automatic Labels: Automatically generates and places Y-axis percentage labels for clarity.
- Fully Responsive: Scales perfectly to look crisp and clear on any screen size.
- Customizable: Easily customize colors and styles to match your app's theme.
- Optimized Performance: Built for smooth rendering and a native feel.
- Cross-Platform: Works on both iOS and Android.
Installation 💻
Install the package:
npm install react-native-funnel-graphor
yarn add react-native-funnel-graphFor iOS, link the pods:
cd ios && pod install && cd ..
Basic Usage 🚀
import React from 'react';
import { View } from 'react-native';
import FunnelChart from 'react-native-funnel-graph';

const App = () => {
  const funnelData = [
    {
      value: 100,
      label: 'Impressions',
      colors: { side: '#FFB179', top: '#FFD4B2' },
      textColor: '#A05822',
    },
    {
      value: 50,
      label: 'Clicks',
      colors: { side: '#FF8A65', top: '#FFAB91' },
      textColor: '#B71C1C',
    }
  ];

  return (
    <View style={{ flex: 1, padding: 20 }}>
      <FunnelChart
        data={funnelData}
        yAxisInterval={20} // Shows 0%, 20%, 40%, 60%, 80%, 100%
        width={350}
        height={400}
      />
    </View>
  );
};
Props 🔧
| Prop | Type | Default | Description |
| --------------------- | ------- | ------- | ---------------------------------------------------------------------------------------------------------- |
| data | Array | [] | (Required) The dataset for the funnel. See the data object structure below. |
| width | number| 350 | The total width of the SVG container in pixels. |
| height | number| 200 | The total height of the SVG container in pixels. |
| yAxisInterval | number| 25 | The interval for Y-axis percentage labels. |
| maxFunnelWidthRatio | number| 0.85 | A value from 0 to 1 representing the width of the funnel's top relative to the chart area. |
| minFunnelWidthRatio | number| 0.2 | A value from 0 to 1 representing the width of the funnel's narrowest point relative to the chart area. |
Data Object Structure
Each object in the data array can have the following properties:
| Key | Type | Required | Description |
| ----------- | -------- | -------- | ------------------------------------------------------------------------------ |
| value | number | Yes | The numerical value for this segment. Must be in descending order. |
| label | string | Yes | The text label to display inside the segment. |
| colors | object | No | An object with side and top color strings. Defaults to a green theme. |
| textColor | string | No | The color for the segment's label text. Defaults to #FFFFFF. |
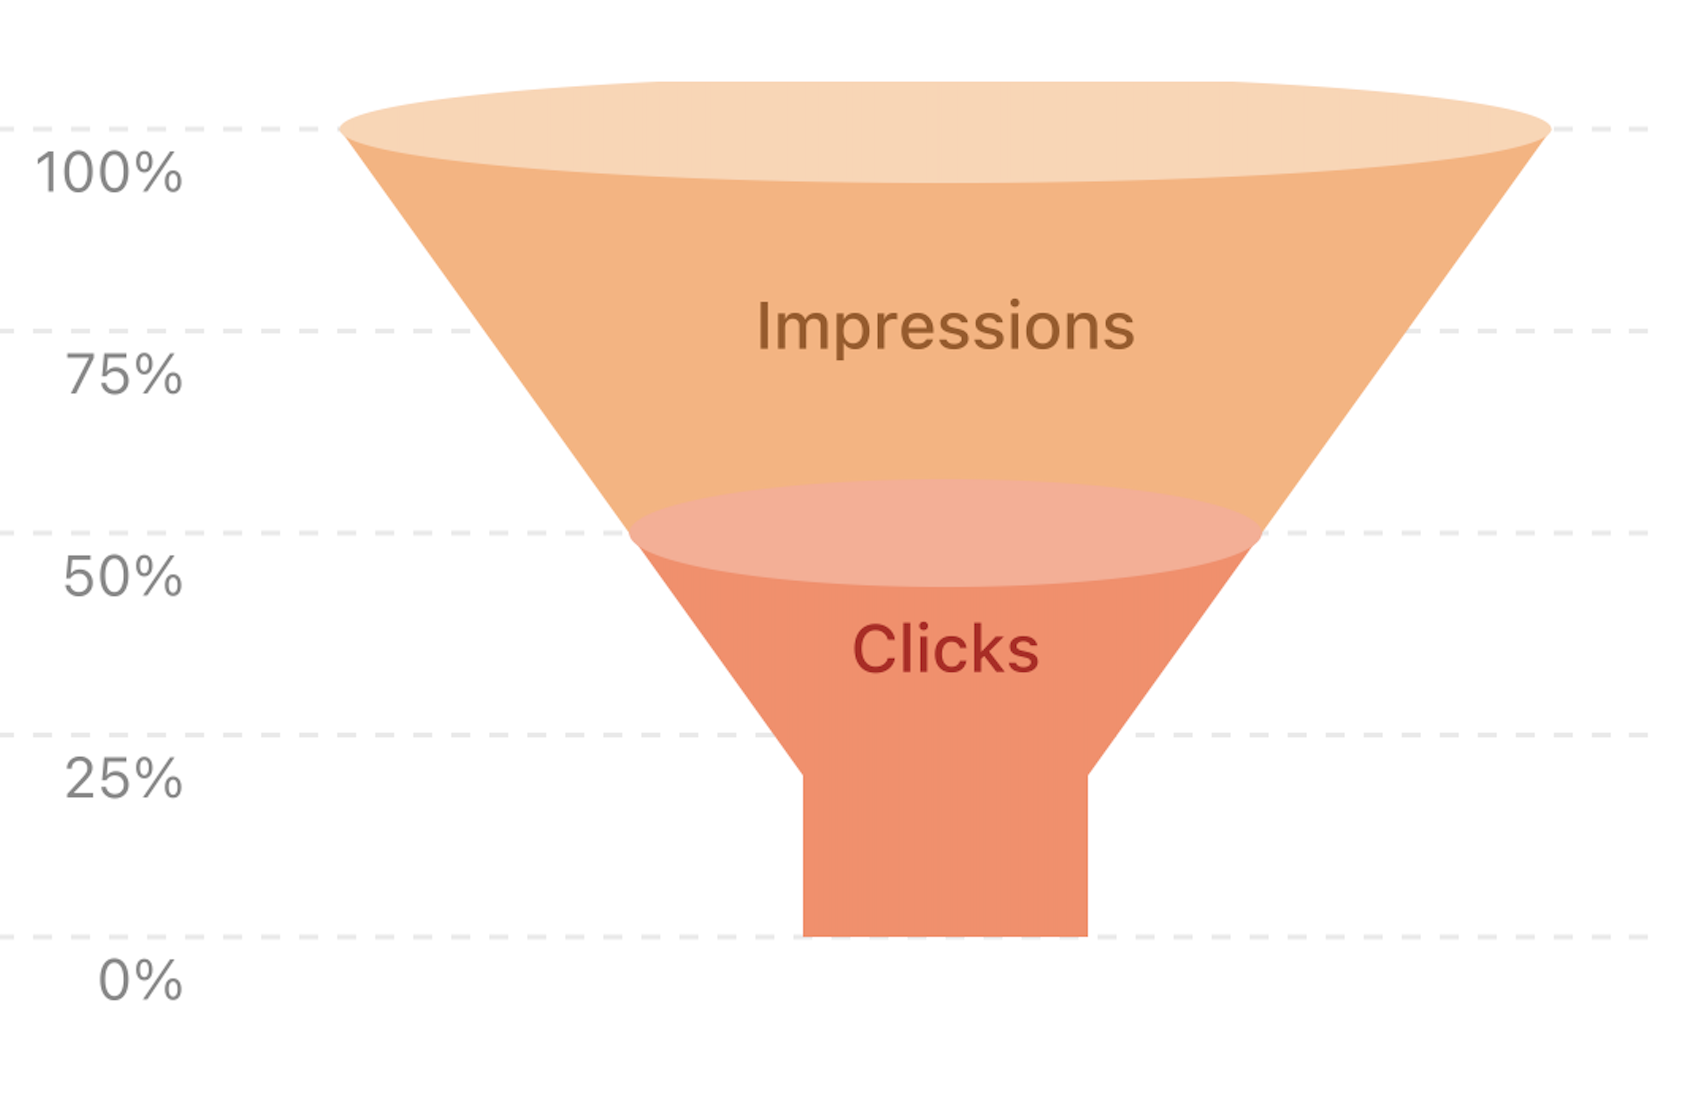
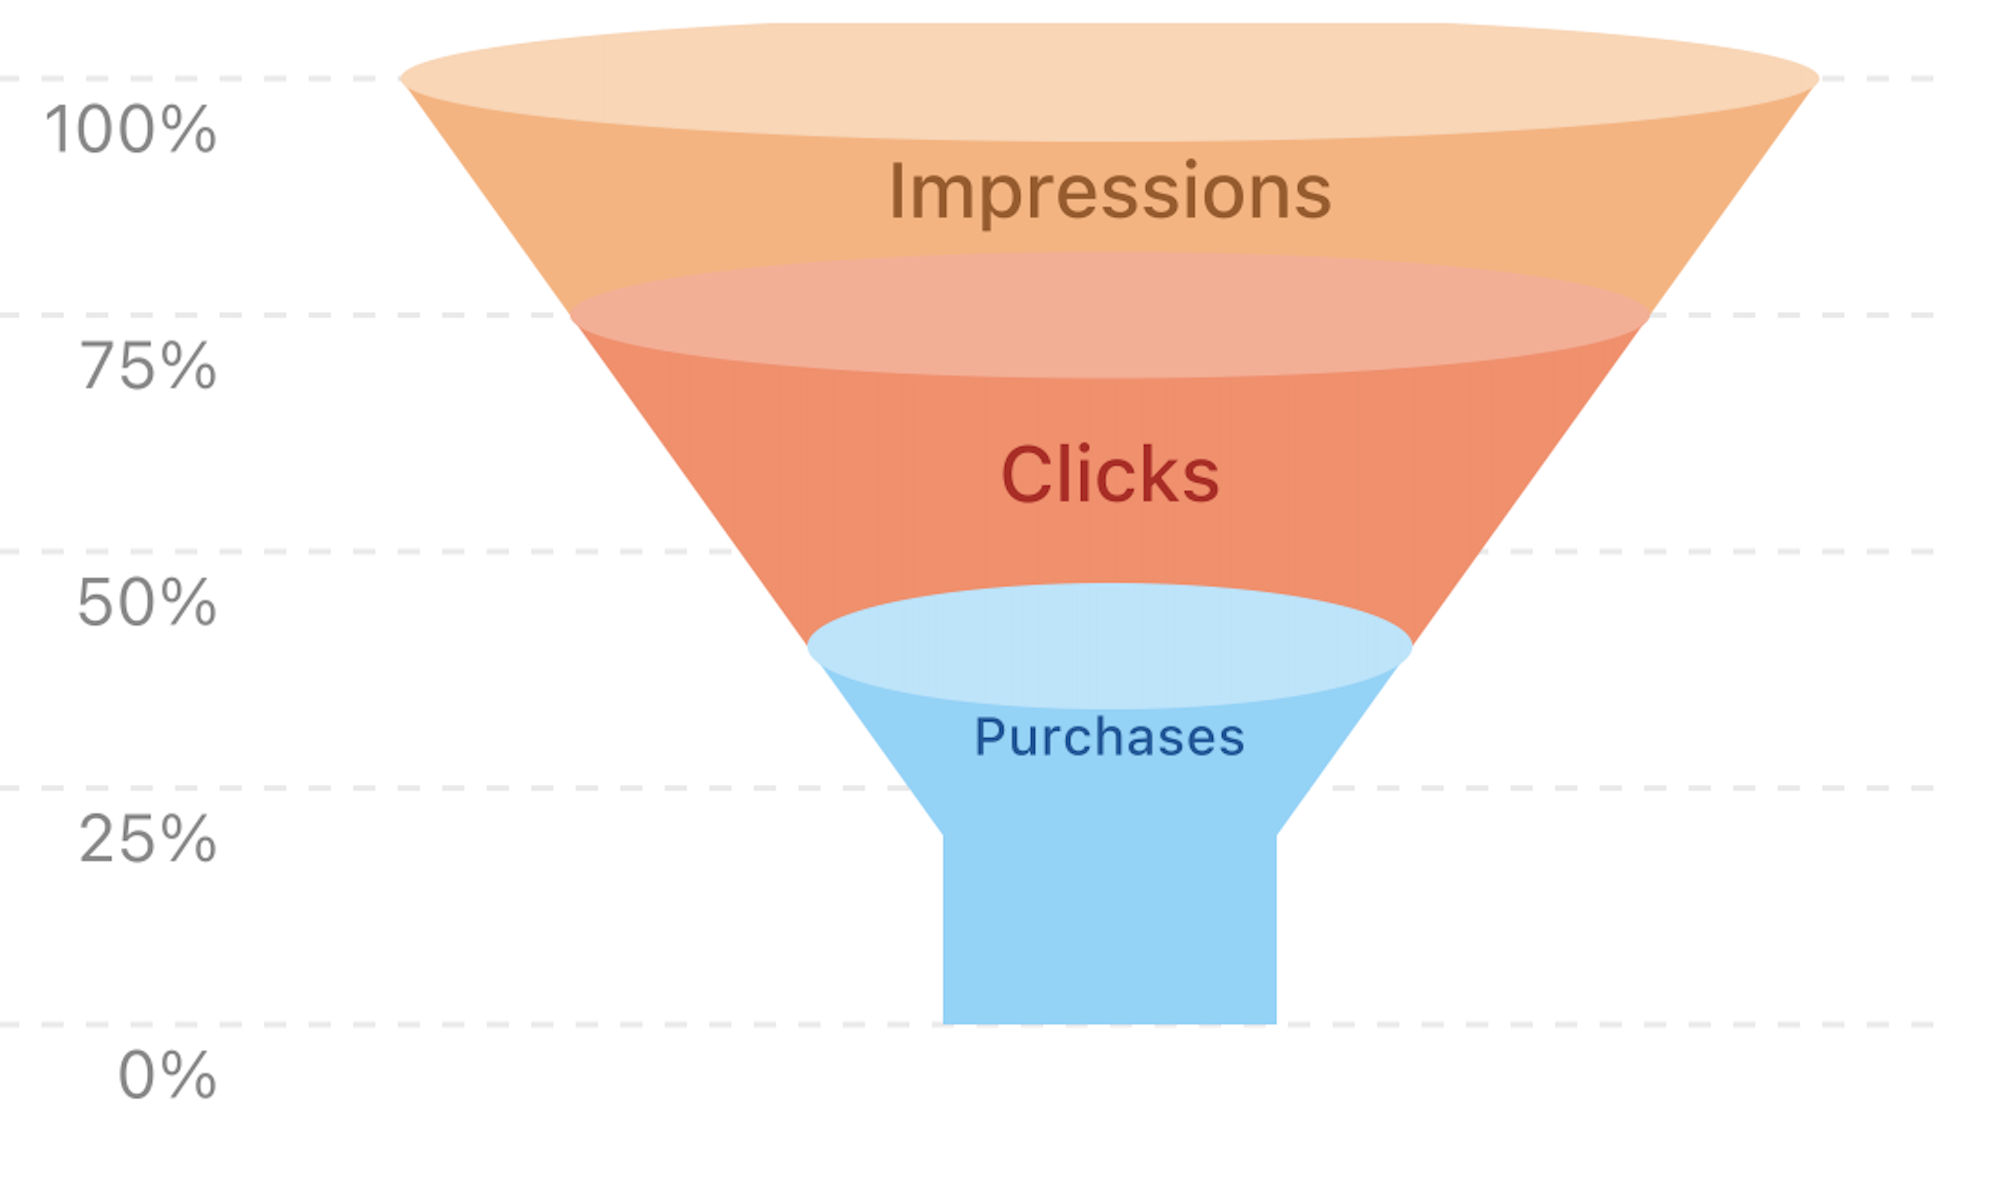
Examples 🎨
Custom Colors
<FunnelChart
  data={[
    {
      value: 100,
      label: 'Visitors',
      colors: { side: '#FF7043', top: '#FF8A65' }
    }
  ]}
/>
Different Interval
<FunnelChart
  yAxisInterval={20}  // Shows 0%, 20%, 40%, etc.
  data={data}
/>
Troubleshooting 🔍
Chart not showing?
- Run
pod installfor iOS. - Ensure the Metro server is running without errors.
- Verify that your
dataarray follows the correct structure.
Text is cut off?
- Increase the
widthof the chart. - Use shorter
labeltext. - Adjust the
minFunnelWidthRatioto give text more space.
Contributing
Contributions are welcome! Please feel free to submit a pull request or open an issue at the GitHub repository if you find a bug or have a feature request.
License 📄
This project is licensed under the ISC License.
[1] https://img.shields.io/npm/v/react-native-funnel-graph.svg?style=flat
[2] https://www.npmjs.com/package/react-native-funnel-graph
[3] https://img.shields.io/badge/License-ISC-blue.svg