
react-native-ios-charts
v0.3.0
Published
[](https://www.npmjs.com/package/react-native-ios-charts) [](https://www
Maintainers
 jpadilla1293
Readme
react-native-ios-charts


Bringing iOS Charts to React Native.
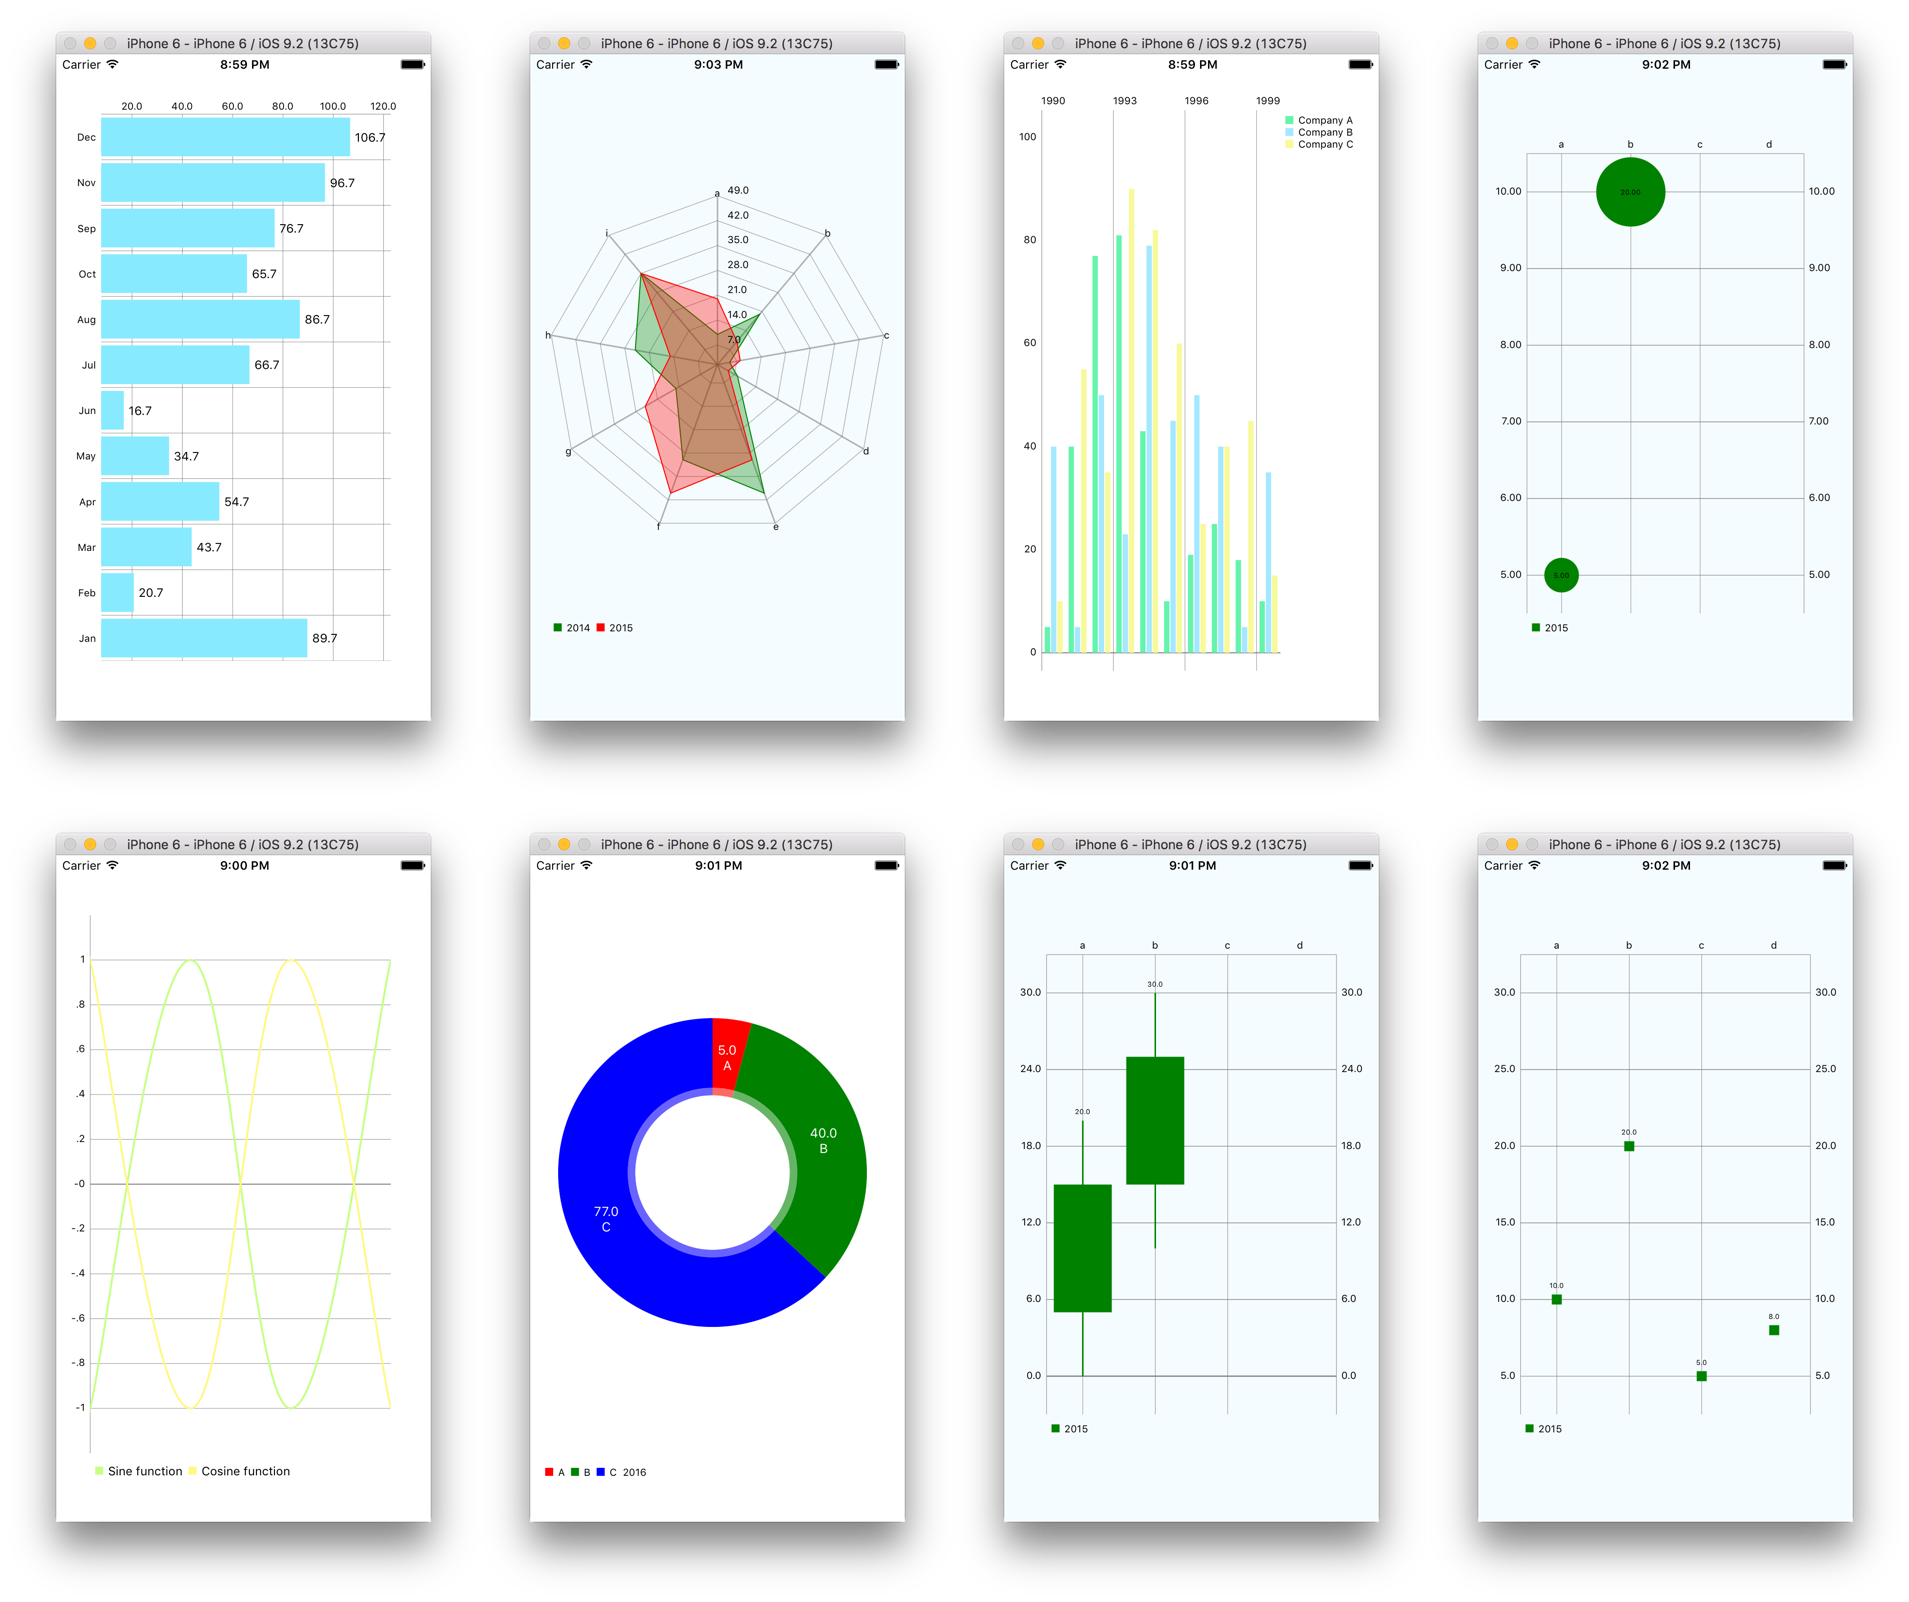
Check out the ChartsExplorer in the examples folder
Introduction
The aim of this library is to provide reusable React Native components that can graph charts like Bar, Line, Scatter, Combined, Pie, Candle, Bubble from the awesome ios-charts library.
Installation
The minimum deployment target should be set to iOS 8.0 or greater
- Run
npm install --save react-native-ios-charts - Add all the files under node_modules/react-native-ios-charts/RNiOSCharts. (In Xcode: File -> Add files to "App Name")
- When you add the files XCode should prompt you to create a bridging header if you haven't done so already. Create it and import the
RCTViewManager.h. It should look something like this.
#import "RCTBridge.h"
#import "RCTViewManager.h"
#import "RCTUIManager.h"
#import "UIView+React.h"
3.5. You can use CocoaPods and skip steps 4-6. Just add a Podfile to your ios directory with the following content. Then run pod install and open the generated .xcworkspace from now on in xcode.
use_frameworks!

target 'MyApp' do
  pod 'SwiftyJSON', git: 'https://github.com/IBM-Swift/SwiftyJSON.git'
  pod 'Charts', git: 'https://github.com/danielgindi/Charts.git', branch: 'Swift-3.0'
end

post_install do |installer|
  installer.pods_project.targets.each do |target|
    target.build_configurations.each do |config|
      config.build_settings['SWIFT_VERSION'] = '3.0'
    end
  end
end- Install SwiftyJSON and iOS Charts libraries and add
SwiftyJSON.xcodeprojandCharts.xcodeprojfiles to your project. - Under
Build Phases, underLink Binary With Libraries, click the plus sign and addSwiftyJSON.frameworkandCharts.framework. - Add the
SwiftyJSON.frameworkandCharts.frameworkto theEmbedded Binariessection in your app. - In your project's build settings, go to build options and change the
Embedded Content Contains Swift CodetoYes.
Usage
Currently supported charts:
Example code:
var { BarChart } = require('react-native-ios-charts');

var MyComponent = React.createClass({
  render: function() {
    return (
      <View style={styles.container}>
        <BarChart
          config={{
            dataSets: [{
              values: [1, 2, 3, 10],
              colors: ['green'],
              label: '2015',
            }, {
              values: [3, 2, 1, 5],
              colors: ['red'],
              label: '2014',
            }],
            labels: ['a', 'b', 'c', 'd'],
          }}
          style={styles.chart}
        />
      </View>
    );
  }
});

var styles = StyleSheet.create({
  chart: {
    width: 200,
    height: 200
  }
})
Roadmap
- [X] Support for all charts
- [X] Examples
- [ ] Support for all chart properties
- [ ] Documentation
License
The MIT License (MIT)
Copyright (c) 2016 Jose E. Padilla
Permission is hereby granted, free of charge, to any person obtaining a copy of this software and associated documentation files (the "Software"), to deal in the Software without restriction, including without limitation the rights to use, copy, modify, merge, publish, distribute, sublicense, and/or sell copies of the Software, and to permit persons to whom the Software is furnished to do so, subject to the following conditions:
The above copyright notice and this permission notice shall be included in all copies or substantial portions of the Software.
THE SOFTWARE IS PROVIDED "AS IS", WITHOUT WARRANTY OF ANY KIND, EXPRESS OR IMPLIED, INCLUDING BUT NOT LIMITED TO THE WARRANTIES OF MERCHANTABILITY, FITNESS FOR A PARTICULAR PURPOSE AND NONINFRINGEMENT. IN NO EVENT SHALL THE AUTHORS OR COPYRIGHT HOLDERS BE LIABLE FOR ANY CLAIM, DAMAGES OR OTHER LIABILITY, WHETHER IN AN ACTION OF CONTRACT, TORT OR OTHERWISE, ARISING FROM, OUT OF OR IN CONNECTION WITH THE SOFTWARE OR THE USE OR OTHER DEALINGS IN THE SOFTWARE.