
react-satti-chart
v1.0.1
Published
react charts


Readme
REACT SATTI CHART
A simple Bar Chart component for ReactJS
Intall
You can get it on NPM installing react-satti-chart component as a project dependency.
npm install react-satti-chart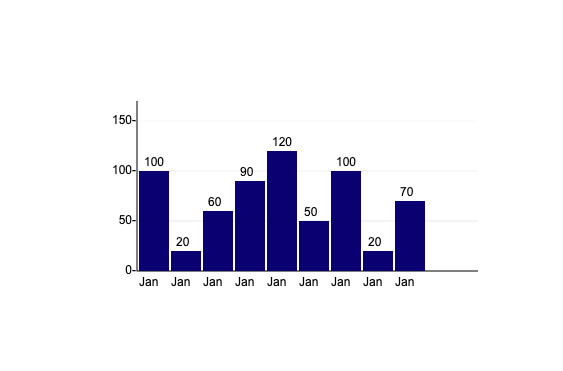
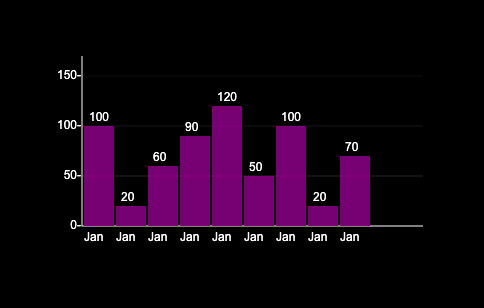
Setup
You'll need to add react-satti-chart to your app.js or any other component where you want to use loader. So that, the <BarChart /> components will be accessible in your application.
...
import { BarChart } from "react-satti-chart";
...
function App() {
	const [data, setData] = useState([])
	useEffect(() => {
		setData([
			{
				label: "Jan",
				value: 120
			},
			{
				label: "Feb",
				value: 160
			},
			{
				label: "Mar",
				value: 190
			},
			{
				label: "Apr",
				value: 60
			},
			{
				label: "May",
				value: 90
			}
		])
	}, [])

	return (
		<div className="App">
			<BarChart
				width="400"
				height="500"
				data={data}
				barColor="purple"
				barWidth={50}
			/>
		</div>
	);
}
Options
data: Array - it should be label & values of array ex([{label: "A", value: 80}])width: string - width of the canvas element;height: string - height of the canvas element;isDarkMode: booloan - default false;showValue: booloan - default true, if false values will not visible in top of the each barshowYIndicatorLines: booloan - default true, if false Y indicator lines will not visiblelineColor: string - line color of X & YbarColor: string - applies color of each bartextColor: string - applies color of every textincreamentY: number - increaments of Y axisbarWidth: number - width of the bar size