
react-use-echarts
v3.1.3
Published
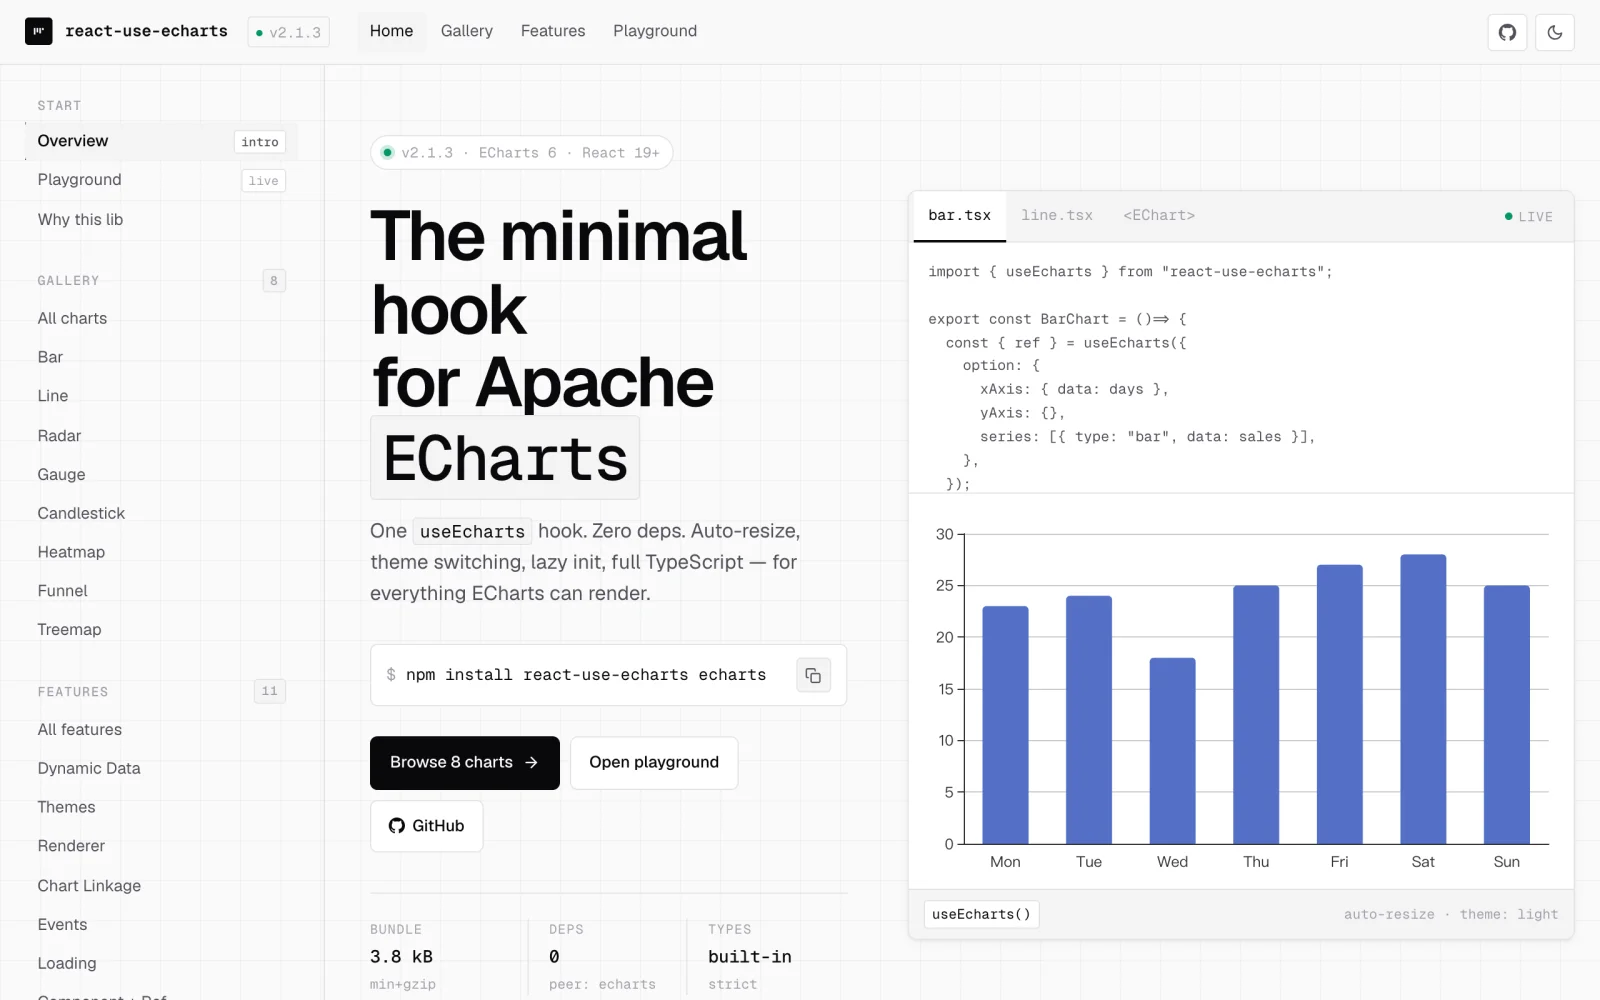
React hooks & component for Apache ECharts — TypeScript, auto-resize, themes, lazy init
Downloads
2,126
Maintainers
 chinshi_x
Readme
react-use-echarts


![]()
![]()


React hooks & component for Apache ECharts — TypeScript, auto-resize, themes, lazy init.
📊 Live demo & interactive playground →
Features
- Hook + Component — use
useEchartshook or the declarative<EChart />component - TypeScript first — complete type definitions with IDE autocomplete
- Zero dependencies — no runtime deps beyond peer deps
- Auto-resize — handles container resizing via ResizeObserver
- Themes — built-in light, dark, and macarons themes, plus any custom theme
- Chart linkage — connect multiple charts for synchronized interactions
- Lazy initialization — defer chart init until element enters viewport
- StrictMode safe — instance cache with reference counting handles double mount/unmount
Why react-use-echarts?
A modern, hook-first wrapper for teams on React 19 + ECharts 6. ECharts stays the single source of truth — you pass EChartsOption straight through, with no abstraction layer to re-learn.
| | react-use-echarts | echarts-for-react |
| ------------- | ------------------------------------------------- | ------------------------ |
| API | useEcharts hook and <EChart /> component | Component only |
| Built for | React 19 — callback ref, StrictMode-safe | React 16–18 era |
| Auto-resize | ResizeObserver + RAF, on by default | ✓ |
| Lazy init | Built-in lazyInit (IntersectionObserver) | Manual |
| Chart linkage | Built-in group prop | Manual echarts.connect |
| Error routing | onError for chart operations and imperative API | Manual try/catch |
| Format & deps | ESM-only, tree-shakeable, zero runtime deps | CJS + ESM, zero deps |
Already using echarts-for-react? Most props map 1:1 — see Migrating from echarts-for-react.
Requirements
- React 19.2+ (
react+react-dom) —useEffectEventis used internally and reached stable in 19.2 - ECharts 6.x
- Node.js 22.13+ (required by the package metadata for installation and build tooling; the runtime chart code remains browser-only ESM)
CSR only. ECharts needs a live DOM; SSR is not supported.
ESM-only since 1.3.0. The package publishes ESM entries for the main API (
dist/index.js) plus thepreset-fullandthemes/registrysubpaths. Every modern bundler (Vite, Next.js, webpack 5+, Rspack, Parcel, Turbopack) and Node 22+ (require(ESM)) consume them natively. If you still depend on CJS-only tooling, pin to1.2.x.
Installation
npm install react-use-echarts echarts
# or
yarn add react-use-echarts echarts
# or
pnpm add react-use-echarts echarts
Register ECharts modules
Since v2.1 react-use-echarts is fully modular — it does not auto-register any ECharts chart, component, renderer or feature. Call one of the registrars below once at your application entry, before the first chart renders:
// Simplest — registers everything ECharts ships with (~370 KB gzip with ECharts 6.1;
// exact size varies by ECharts version and bundler).
import { registerEchartsFull } from "react-use-echarts/preset-full";
registerEchartsFull();
Or, for tree-shake-friendly production builds, register only what you actually render — see Tree-shaking for the recipe.
Why? The default
react-use-echartsentry imports onlyecharts/core, so it does not force the full ECharts surface into every consumer bundle. Explicit registration lets each app choose the one-line full preset or a smaller selective module list.
Quick Start
1. Register ECharts Once
For the fastest start, register the full ECharts surface at your app entry:
// main.tsx / index.tsx
import { registerEchartsFull } from "react-use-echarts/preset-full";

registerEchartsFull();
For production bundles that only render a few chart types, replace this with selective echarts.use([...]) registration later; the chart API stays the same.
2. Render a Chart
The simplest component path — no ref needed:
import { EChart } from "react-use-echarts";

function MyChart() {
  return (
    <EChart
      style={{ width: "100%", height: 400 }}
      option={{
        xAxis: { type: "category", data: ["Mon", "Tue", "Wed", "Thu", "Fri"] },
        yAxis: { type: "value" },
        series: [{ data: [150, 230, 224, 218, 135], type: "line" }],
      }}
    />
  );
}
The chart container must have an explicit size. The example above sets it on <EChart />; if you keep the default { width: "100%", height: "100%" }, make sure the parent has an explicit height.
Pass ref to access the imperative API — see Returns for the full list (setOption, dispatchAction, clear, resize, appendData, getDataURL, convertToPixel, …).
3. Use the Hook Directly
For full control, use the hook directly. It returns a callback ref to attach to your container plus a reactive instance field and the full imperative API:
import { useEcharts } from "react-use-echarts";

function MyChart() {
  const { ref, instance, setOption, resize } = useEcharts({
    option: {
      xAxis: { type: "category", data: ["Mon", "Tue", "Wed", "Thu", "Fri"] },
      yAxis: { type: "value" },
      series: [{ data: [150, 230, 224, 218, 135], type: "line" }],
    },
  });
  return <div ref={ref} style={{ width: "100%", height: "400px" }} />;
}
instance is undefined before init and after dispose; subscribe via useEffect([instance]) to run side effects against the live ECharts instance.
The chart container must have an explicit size, for example style={{ width: "100%", height: "400px" }}.
Recipes
Themes
Built-in themes require one-time registration at app startup:
import { registerBuiltinThemes } from "react-use-echarts/themes/registry";
registerBuiltinThemes();

// Built-in theme
useEcharts({ option, theme: "dark" });

// Any string registered via echarts.registerTheme
useEcharts({ option, theme: "vintage" });

// Custom theme object (useMemo avoids repeated content-key serialization)
const customTheme = useMemo(() => ({ color: ["#fc8452", "#9a60b4", "#ea7ccc"] }), []);
useEcharts({ option, theme: customTheme });
Note: theme names registered directly via
echarts.registerTheme()(like"vintage"above) work, but trigger a one-time dev-only warning because the library cannot see that registration. PreferregisterCustomTheme(name, config)fromreact-use-echarts— it registers the theme by name through the library, which silences the warning. If you must register viaecharts.registerTheme()(e.g. a third-party package does it for you), the warning is safe to ignore as long as registration happens before the chart mounts; it never appears in production builds.
Event Handling
Supports shorthand (function) and full config (object with query/context). Known echarts events have their params type auto-inferred from EChartsEventPayloadMap — no manual cast needed.
useEcharts({
  option,
  onEvents: {
    // `params` is auto-typed as `ECElementEvent`
    click: (params) => console.log("clicked", params.data),
    mouseover: {
      handler: (params) => console.log("hovered", params.value),
      query: "series",
    },
    // `params` is auto-typed as `SelectChangedPayload`
    selectchanged: (params) => console.log("selection changed", params),
  },
});
Custom event names (e.g. registered via echarts.registerAction()) fall through to the open index signature with a loose params type. To get a typed payload for your own events, augment EChartsEventPayloadMap:
declare module "react-use-echarts" {
  interface EChartsEventPayloadMap {
    "my-custom-action": { foo: number; bar: string };
  }
}
Loading State
const [loading, setLoading] = useState(true);

useEcharts({
  option,
  showLoading: loading,
  loadingOption: { text: "Loading..." },
});
Chart Linkage
Assign the same group ID — tooltips, highlights, and other interactions will sync:
useEcharts({ option: option1, group: "dashboard" });
useEcharts({ option: option2, group: "dashboard" });
Lazy Initialization
Defer chart init until the element scrolls into view:
useEcharts({ option, lazyInit: true });

// Custom IntersectionObserver options
useEcharts({
  option,
  lazyInit: { rootMargin: "200px", threshold: 0.5 },
});
Note: lazy init is a one-shot latch — "lazy" means "defer until first visible", not "track visibility". Once the element has intersected, the chart stays initialized for the hook's lifetime: replacing the container DOM node or toggling
lazyInitoff and back on does not re-arm observation. To start deferring again, remount the component.
Tree-shaking
The library is fully modular — pick the registration tier that matches your build target:
Tier 1 — All-in-one (development / prototyping). One line, ~370 KB gzip with ECharts 6.1 (exact size varies by version and bundler):
import { registerEchartsFull } from "react-use-echarts/preset-full";
registerEchartsFull();
Tier 2 — Selective (recommended for production). Register only what you render — bundlers tree-shake the rest of ECharts away:
import * as echarts from "echarts/core";
import { LineChart } from "echarts/charts";
import { GridComponent, TooltipComponent } from "echarts/components";
import { CanvasRenderer } from "echarts/renderers";
echarts.use([LineChart, GridComponent, TooltipComponent, CanvasRenderer]);
See examples/selective-registration/SelectiveRegistrationChart.tsx for a runnable demo.
Tier 3 — Existing full-entry registration. If your app already imports the full "echarts" entry, ECharts performs its built-in registrations and you do not need to call registerEchartsFull() as well. Tier 1 makes the full-registration choice explicit; Tier 2 remains the smaller production path.
ECharts maintains a single global registry —
echarts.use([...])andregisterEchartsFull()compose freely. You can call them in any order, anywhere in your app, but they must run before the firstuseEcharts()render.
Use with Next.js (App Router)
The default package entry, preset-full, and themes/registry are marked
with "use client", so importing them inside any React Server Component file
does not bundle ECharts into the server payload. Wrap the chart in your own
client component and import it from any Server Component:
// app/components/MyChart.tsx
"use client";
import { EChart } from "react-use-echarts";
import { registerEchartsFull } from "react-use-echarts/preset-full";

registerEchartsFull();

export function MyChart() {
  return (
    <EChart
      style={{ height: 400 }}
      option={{
        xAxis: { type: "category", data: ["A", "B", "C"] },
        yAxis: { type: "value" },
        series: [{ type: "line", data: [1, 2, 3] }],
      }}
    />
  );
}
// app/page.tsx (Server Component) — imports the Client Component directly
import { MyChart } from "./components/MyChart";
export default function Page() {
return <MyChart />;
}Pages Router only: if you need to load the chart inside
getServerSideProps/getStaticPropspages and force client-only rendering, usedynamic(() => import("./components/MyChart").then((m) => m.MyChart), { ssr: false }). In the App Router,next/dynamicwithssr: falseis disallowed inside Server Components — the"use client"directive already does the right thing.
Gotchas
- Container needs explicit size — the chart won't render in a zero-height div; give the container
height(andwidthif not 100%). - Forgetting to register ECharts modules —
useEcharts()initializes a chart against ECharts' shared global registry, so charts/components/renderers/features must be registered (viaregisterEchartsFull()orecharts.use([...])) before the first render. A missing registration usually shows up asRenderer 'undefined' is not importedor a chart that silently never paints; see Register ECharts modules. In dev, if init throws… is not a constructor, the library also prints a one-time hint pointing you here. - Keep
onEventscontents stable — inline wrapper objects are deduplicated when their handler/query/context references are unchanged, but inline lambdas create new handlers and trigger a rebind. Memoize or hoist handlers used in frequently-rendered charts. - Don't share one DOM element across multiple
useEchartshooks — the instance cache reuses a single ECharts instance and emits a dev warning; updates from different hooks will overwrite each other. initOptsand customthemeobjects are keyed by serialized content — equivalent serializable objects do not recreate the instance, but memoizing avoids repeated serialization and makes intent clear. Never mutate either object in place: the same reference is treated as unchanged.optionupdates are reference-driven — every newoptionreference callssetOption, while in-place mutation of the same object is not observed. Memoize expensive options when parent renders are frequent, and replace the wrapper object when chart data changes.- StrictMode is safe — double mount/unmount is handled by the reference-counted instance cache.
API Reference
<EChart /> Props
Declarative component wrapping useEcharts. Accepts all hook options as props plus:
| Prop | Type | Default | Description |
| ----------- | --------------------- | ----------------------------------- | -------------------------------------------------------------------------------------------------------------------------------- |
| style | React.CSSProperties | { width: '100%', height: '100%' } | Container style (merged with defaults) |
| className | string | — | Container CSS class |
| ref | Ref<EChartHandle> | — | Exposes the imperative API as EChartHandle (Omit<UseEchartsReturn, 'ref'> — the container ref is owned by <EChart> itself) |
All other native div attributes are forwarded to the chart container, including id,
role, aria-*, data-*, tabIndex, and DOM event handlers. children and
dangerouslySetInnerHTML are excluded because ECharts owns the container contents;
onError remains the chart error handler.
useEcharts(options)
Options
| Option | Type | Default | Description |
| --------------- | ------------------------------------- | ---------- | -------------------------------------------------------------------------------------------------------------------------------------------- |
| option | EChartsOption | (required) | ECharts configuration |
| theme | string \| object | — | Any registered theme name, or custom theme object |
| renderer | 'canvas' \| 'svg' | 'canvas' | Renderer type |
| lazyInit | boolean \| IntersectionObserverInit | false | Lazy initialization via IntersectionObserver |
| group | string | — | Chart linkage group ID |
| setOptionOpts | SetOptionOpts | — | Default options for setOption calls |
| showLoading | boolean | false | Show loading indicator |
| loadingOption | object | — | Loading indicator configuration |
| onEvents | EChartsEvents | — | Event handlers (fn or { handler, query?, context? }) |
| autoResize | boolean | true | Auto-resize via ResizeObserver |
| initOpts | EChartsInitOpts | — | Passed to echarts.init() (devicePixelRatio, locale, width, etc.) |
| onError | (error: unknown) => void | — | Error handler for chart operations and imperative API calls. Without it, effect failures log via console.error; imperative methods rethrow |
Returns
Prefer the declarative props (
option,theme,showLoading, …) over imperative methods. Use these methods only when a prop does not cover the action — image export, coordinate conversion, streaming append, etc. All methods are no-ops or return safe defaults when the instance is not yet initialized. When the instance throws, errors are routed throughonErrorif provided (and the call returns the fallback); otherwise the error is rethrown — including from readers (noconsole.errorfallback for imperative methods).
Container ref / live instance
| Property | Type | Description |
| ---------- | ----------------------------- | -------------------------------------------------------------------------------------------------------------------------------------------------------- |
| ref | RefCallback<HTMLDivElement> | Callback ref to attach to the chart container. Compose with your own ref via mergeRefs |
| instance | ECharts \| undefined | Reactive — defined after init, undefined before init and after dispose. Subscribe via useEffect([instance]) to run side effects on the live instance |
Lifecycle / updates
| Method | Type | Description |
| ---------------- | ------------------------------------------------------------------------------------ | ----------------------------------------------------------------------------------------------------------------------------------------- |
| setOption | (option: EChartsOption, opts?: SetOptionOpts) => void | Update chart configuration |
| dispatchAction | (payload: Payload, opt?: boolean \| { silent?: boolean; flush?: boolean }) => void | Dispatch an ECharts action (highlight, downplay, showTip, etc.) |
| clear | () => void | Clear current chart content |
| resize | (opts?: ResizeOpts) => void | Manually trigger chart resize. ResizeOpts accepts width/height/animation/silent |
| appendData | (params: { seriesIndex: number; data: ArrayLike<unknown> }) => void | Append data to a series (streaming). Invalidates prop-sync bookkeeping so the next relevant reactive update can restore declarative state |
Read / introspect
| Method | Type | Description |
| ------------ | ---------------------------------- | ---------------------------------------------------------------------------------------- |
| getOption | () => EChartsOption \| undefined | Get the current merged option |
| getWidth | () => number \| undefined | Container width in pixels |
| getHeight | () => number \| undefined | Container height in pixels |
| getDom | () => HTMLElement \| undefined | Underlying DOM container |
| isDisposed | () => boolean | Whether the instance is disposed (returns true when uninitialized — semantically gone) |
Export
| Method | Type | Description |
| --------------------- | ---------------------------------------------------------- | -------------------------------------------------------- |
| getDataURL | (opts?) => string \| undefined | Base64 image data URL (png / jpeg / svg) |
| getConnectedDataURL | (opts?) => string \| undefined | Combined image of all charts in the same group |
| renderToSVGString | (opts?: { useViewBox?: boolean }) => string \| undefined | Render chart to SVG string (works with the SVG renderer) |
| getSvgDataURL | () => string \| undefined | Get SVG data URL of the current chart |
Coordinate conversion
| Method | Type | Description |
| ------------------ | ------------------------------------------------------------------------------------------------------------------------------------------------------ | ------------------------------------------------------------------------- |
| convertToPixel | (finder: ChartFinder, value: ChartScaleValue \| Array<ChartScaleValue \| ChartScaleValue[] \| null \| undefined>) => number \| number[] \| undefined | Logical → pixel coordinates |
| convertFromPixel | (finder: ChartFinder, value: number \| number[]) => number \| number[] \| undefined | Pixel → logical coordinates |
| containPixel | (finder: ChartFinder, value: number[]) => boolean | Whether a pixel point is inside the matched component (false when uninit) |
ChartFinder is string | { seriesIndex?, seriesId?, …, geoIndex?, … } — a string shorthand or a model finder object. ChartScaleValue is number | string | Date.
Other Exports
import { useLazyInit } from "react-use-echarts"; // standalone lazy init hook -> { ref, isInView }
import { mergeRefs } from "react-use-echarts"; // compose multiple refs into one callback ref
import { isBuiltinTheme, isKnownTheme, registerCustomTheme } from "react-use-echarts"; // theme utils (no JSON)
import { registerBuiltinThemes } from "react-use-echarts/themes/registry"; // ~20KB theme JSON
import { registerEchartsFull } from "react-use-echarts/preset-full"; // one-line full-set registrar (see Register ECharts modules)

// All exported types: UseEchartsOptions, UseEchartsReturn, UseLazyInitReturn,
// EChartProps, EChartHandle, EChartsEvents, EChartsEventConfig, EChartsEventHandler,
// EChartsEventPayloadMap, EChartsInitOpts, BuiltinTheme, LoadingOption,
// ChartFinder, ChartScaleValue, Payload.
// EChartsOption, SetOptionOpts, ResizeOpts are also re-exported here for
// convenience (they originate in the "echarts" package), so you can import them
// from react-use-echarts alongside the types above instead of reaching into echarts.
mergeRefs returns a callback ref that fans the node out to every input — RefObject, legacy callback ref, or React 19 callback ref with cleanup — and isolates each invocation so a throwing 3rd-party ref can't strand the chart. Reach for it when you need both the hook-provided ref and your own:
const myRef = useRef<HTMLDivElement>(null);
const { ref } = useEcharts({ option });
return <div ref={mergeRefs(ref, myRef)} style={{ height: 400 }} />;
Migrating from echarts-for-react
Most props map 1:1; a few are folded into existing options. Quick reference:
| echarts-for-react | react-use-echarts | Notes |
| ------------------------- | ----------------------------------------- | ------------------------------------------------------------------------------------------------------------------------------------------------------------------------------- |
| option | option | Same |
| theme | theme | Same; built-in themes need registerBuiltinThemes() first (see Themes) |
| notMerge / lazyUpdate | setOptionOpts: { notMerge, lazyUpdate } | Folded into a single object passed to setOption |
| showLoading | showLoading | Same |
| loadingOption | loadingOption | Same |
| onEvents | onEvents | Same shape; also accepts { handler, query?, context? } for query/context binding |
| onChartReady | Subscribe to the reactive instance | useEffect(() => { if (instance) onReady(instance); }, [instance]) — the returned instance is undefined before init and re-renders when init/dispose completes |
| opts.renderer | renderer: 'canvas' \| 'svg' | Promoted to a top-level option |
| opts (rest) | initOpts | Same shape (devicePixelRatio, locale, width, height, useDirtyRect, etc.) |
| style | style | <EChart /> defaults to { width: '100%', height: '100%' } so the parent needs size |
| className | className | Same |
| lazyUpdate (top-level) | setOptionOpts: { lazyUpdate: true } | See notMerge row |
| shouldSetOption | Gate the option prop yourself | A new option reference triggers setOption; for custom predicates (deep comparison, throttling, app-state gating), memoize or skip the option prop in the parent component |
| autoResize (4.x) | autoResize | Same default (true); resize uses ResizeObserver + RAF |
| none | lazyInit | New: defer init until the container scrolls into viewport |
| none | group | New: chart linkage via shared group ID |
| none | onError | New: route chart operation errors through a callback (init, setOption, events, loading, resize, group linkage, and imperative calls) |
Side-by-side example:
// echarts-for-react
<ReactECharts
  option={option}
  theme="dark"
  notMerge
  lazyUpdate
  opts={{ renderer: "svg", devicePixelRatio: 2 }}
  onEvents={{ click: handleClick }}
  showLoading={loading}
  onChartReady={(instance) => instanceRef.current = instance}
/>

// react-use-echarts
<EChart
  ref={chartRef}
  option={option}
  theme="dark"
  setOptionOpts={{ notMerge: true, lazyUpdate: true }}
  renderer="svg"
  initOpts={{ devicePixelRatio: 2 }}
  onEvents={{ click: handleClick }}
  showLoading={loading}
/>
// chartRef.current?.instance replaces onChartReady
Migrating from v2.x
v3 removes the legacy react-use-echarts/core subpath. If you already import from react-use-echarts and already register ECharts modules before the first chart render, no code changes are needed.
If you are upgrading from v2.0's everything-included default entry, or from an app that still relied on import "echarts" side effects, add one registration call at your application entry:
// app entry (e.g. main.tsx, index.tsx)
import { registerEchartsFull } from "react-use-echarts/preset-full";
registerEchartsFull();
That call is equivalent to v2.0's automatic ECharts registration and gives you the same everything-included experience (~370 KB gzip with ECharts 6.1; exact size varies by version and bundler). For production builds that only render a few chart types, replace it with a selective echarts.use([...]) — see Tree-shaking.
Replace any remaining from "react-use-echarts/core" imports with from "react-use-echarts".
Migrating from v1
v2.0 flips the hook to return a callback ref + reactive instance, aligning with the modern community convention used by floating-ui/react, react-aria, downshift, and react-hook-form. <EChart /> external props are unchanged — only direct hook consumers and <EChart ref> typings migrate.
| v1 | v2 | Notes |
| ------------------------------------------------ | ---------------------------------------------------- | ------------------------------------------------------------------------------------------------------------------------ |
| const ref = useRef(); useEcharts(ref, options) | const { ref } = useEcharts(options) | Hook owns the callback ref; attach it to your container |
| getInstance() method on the hook return | instance field on the same return | Reactive — re-renders when init/dispose completes; use useEffect([instance]) to subscribe |
| useLazyInit(ref, options) returning boolean | useLazyInit(options) returning { ref, isInView } | Same callback-ref pattern |
| useRef<UseEchartsReturn>(null) for <EChart> | useRef<EChartHandle>(null) for <EChart> | EChartHandle = Omit<UseEchartsReturn, 'ref'> — the container ref is intentionally not exposed on the imperative handle |
| Compose refs by hand | mergeRefs(chartRef, myRef) | New public utility (see Other Exports) |
| engines.node >=20 | engines.node >=22 | Tooling requirement only — published bundle is unaffected |
Side-by-side hook example:
// v1
const chartRef = useRef<HTMLDivElement>(null);
const { setOption, getInstance } = useEcharts(chartRef, { option });
useEffect(() => {
  getInstance()?.on("finished", handler);
}, []);
return <div ref={chartRef} style={{ height: 400 }} />;

// v2
const { ref, instance, setOption } = useEcharts({ option });
useEffect(() => {
  if (!instance) return;
  instance.on("finished", handler);
  return () => instance.off("finished", handler);
}, [instance]);
return <div ref={ref} style={{ height: 400 }} />;
Contributing
We welcome all contributions. Please read the contributing guidelines first.
Changelog
Detailed changes for each release are documented in the release notes.