
rowpine
v1.0.4
Published
Pivot tables and Excel and PDF export for TanStack Table and shadcn/ui data tables.

Maintainers
 jqxelements
Readme
rowpine
Pivot tables, a pivot designer, and Excel and PDF export for TanStack Table and shadcn/ui data tables. Works with TanStack Table v8 and v9.
Website · Demos · Docs · Pricing
Install
npm install rowpine
npx shadcn add @rowpine/export-menu
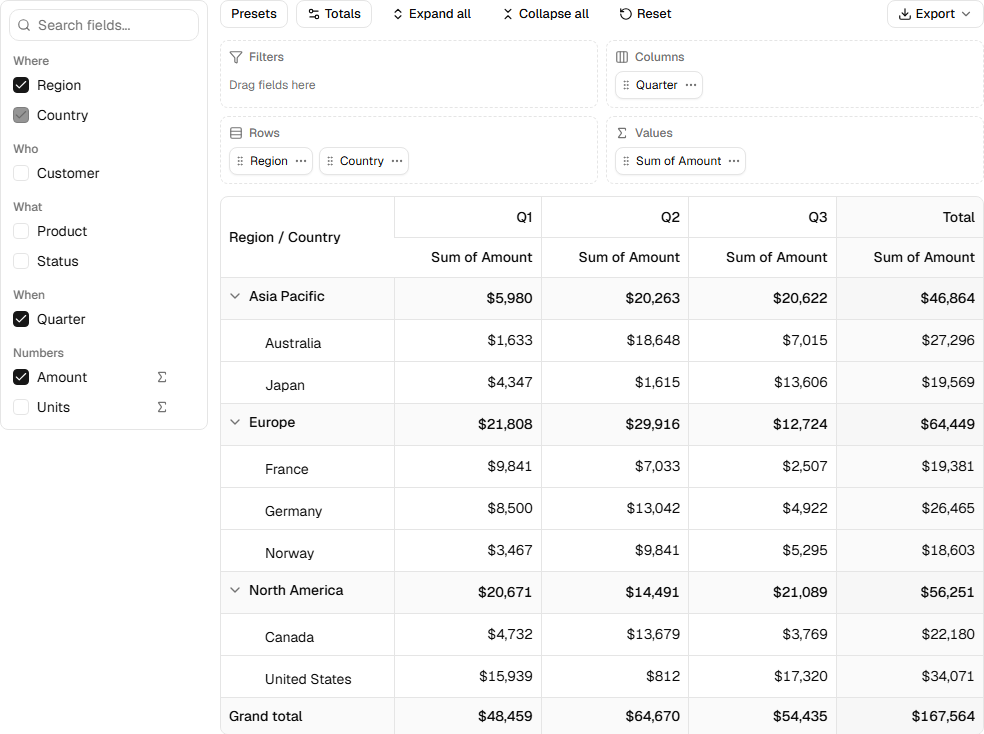
npx shadcn add @rowpine/pivot
This package is the engine: the file writers, the pivot and the license check. The two shadcn add lines copy the export menu, the pivot table and the pivot designer into your project as source.
Export
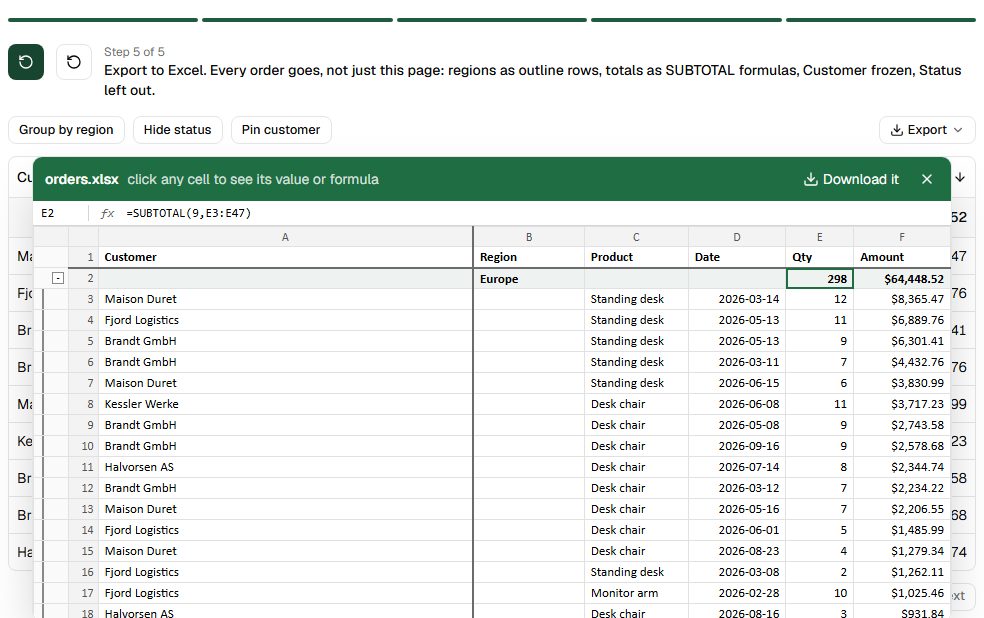
Pass the TanStack table you already render. The file matches the screen: visible columns in their order, every filtered row on every page, the current sort, pinned columns frozen, groups as Excel outline rows with SUBTOTAL formulas, typed numbers and dates.
import { exportCsv, exportPdf, exportXlsx, setLicenseKey } from "rowpine"

setLicenseKey(import.meta.env.VITE_ROWPINE_KEY)

await exportXlsx(table, { fileName: "orders" })
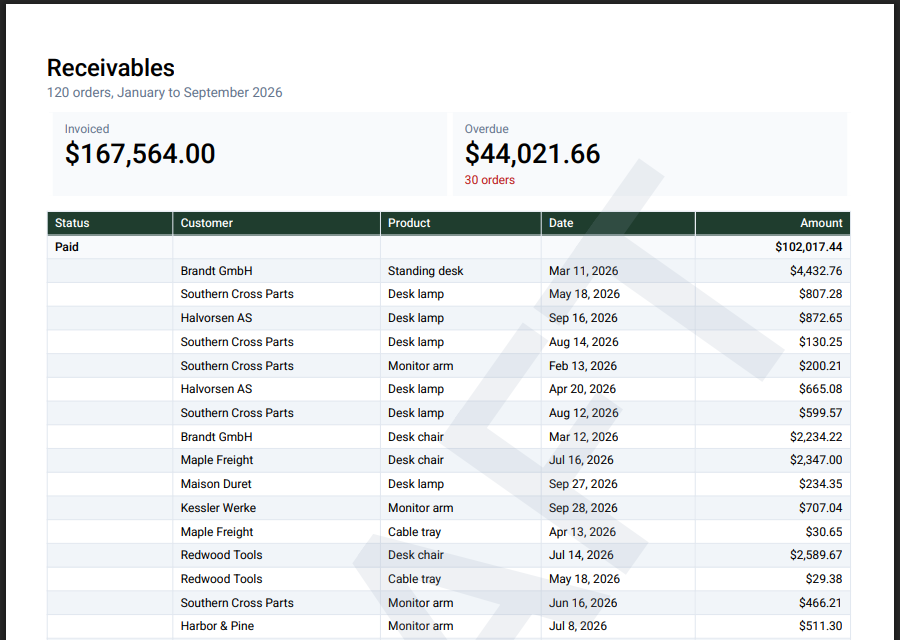
await exportPdf(table, { fileName: "orders", title: "Orders" })
await exportCsv(table, { fileName: "orders" }) // free, no key needed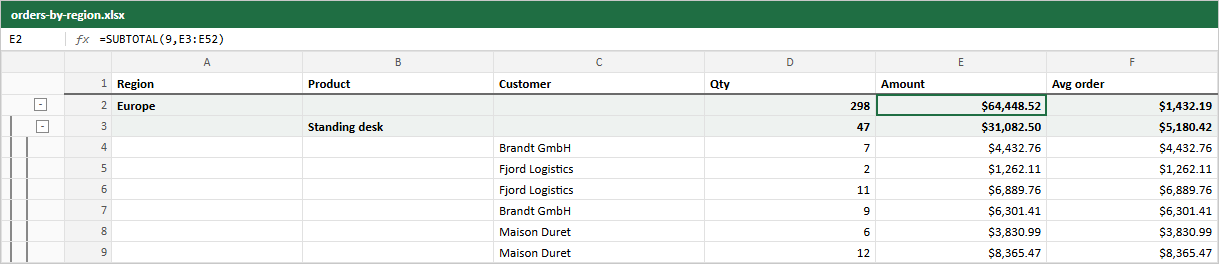
rows: "all" | "page" | "selected" picks the rows (default "all": every filtered row on every page). rowStyle styles whole rows. download: false returns the Blob without saving it.
Per-column settings go in meta.rowpine:
{
  accessorKey: "amount",
  header: "Amount",
  aggregationFn: "sum",
  meta: {
    rowpine: {
      numFmt: '"$"#,##0.00',                    // Excel number format
      format: (v) => money.format(v as number), // PDF text
      cellStyle: (v) => ((v as number) > 5000 ? { fill: "#dcfce7" } : undefined),
    },
  },
}
Also: header, width, align, exclude.
Page size and orientation, a title, headline numbers, a watermark, group rows with their totals, the header row on every page. Wide tables shrink and then split so every column prints.
Pivot
import { createPivot, exportXlsx, pivotRowStyle } from "rowpine"

const pivot = createPivot(orders, {
  rows: ["region", "country"],
  cols: ["quarter"],
  values: [{ field: "amount", agg: "sum", label: "Amount" }],
})

pivot.data     // rows nested through subRows, for useTable / useReactTable
pivot.columns  // column definitions with accessor functions
await exportXlsx(pivot.table, { rowStyle: pivotRowStyle })
Aggregations: sum, avg, min, max, count, countDistinct, first, last, or a function. Subtotals and grand totals are on by default (rowSubtotals, grandTotalRow, grandTotalCol). The pivot designer's layout rules are exported too (addToWell, setAggregatorAt, pivotFromLayout and more), so you can drive a layout from your own UI.
Demos
Ten demos play a short story on the live component and end with the exported file. Open the demos.
License key
CSV export is free. Excel, PDF and pivots need a key; without one everything still runs, and Excel and PDF files carry one notice line. A key covers every version released during its year of updates, for good. Keys are checked in the browser, with no call to a server. Pricing.
Commercial license: see LICENSE.md or https://rowpine.com/license.html.