
rowtoll
v0.2.1
Published
A benchmark harness for in-memory JavaScript collections and query engines: every result checked against Array.prototype.filter, rows examined counted through the records themselves, and the best possible index set computed by exhaustive search, across wo
Downloads
672

Maintainers
 destbreso
Readme
rowtoll
What a query costs is not how long it took. It is how much of the collection it had to walk.
Every database in the world reports that number. MySQL calls it Rows_examined
and puts it in the slow log; it is the first thing anyone looks at when a query
is slow, because it survives a noisy machine, a busy CPU and a different laptop.
No in-memory JavaScript collection reports it at all.
rowtoll measures it from the outside, for engines that never agreed to be
measured, and checks every answer against Array.prototype.filter while it is
at it.
npm install --save-dev rowtoll
npx rowtoll --scale 0.25 --out BENCHMARKS.md
npx rowtoll --replicates 7 --out BENCHMARKS.md   # before you publish a clock figure
The full panel from this machine, tables and all, is committed at
rowtoll-report/BENCHMARKS.md, together with the
raw results.json it was rendered from and the figures drawn from that same
file.
How it counts
Hand the engine records whose fields count their own reads.
import { instrument } from "rowtoll";

const meter = instrument(rows);          // same values, accessors instead of data
const collection = new Whatever(meter.rows);
meter.reset();                           // the build is a separate number
collection.find({ where: [{ field: "status", op: "eq", value: "open" }] });
meter.total();                           // 200000: it walked the whole thing
Nothing has to cooperate. sift, mingo and lokijs are all fully visible in their default configuration, and so is anything else that holds a reference to your records.
Three properties of this instrument decide how every number is allowed to be reported.
It counts field reads, not rows. That is a feature. A scan applying two predicates reads the first field on every row and the second only on the survivors, so the order predicates are tested in shows up in the number, and ordering predicates by measured selectivity is the part of a query optimizer that actually pays for itself. It is how the panel shows, without a profiler, that sift evaluates every predicate on every row while mingo short-circuits. On the three-predicate workload sift reads 6,000,000 on each of the three, for 18,000,000, while everything else reads 6,000,000, then 2,984,700 on what survived, then 249,005 on what survived that, for 9,233,705.
A counter cannot tell a copy from an index. An engine that copies your values
at load and one that indexes them at load look identical to it: both read
everything once, both then answer without touching a record. So the harness also
changes one value silently behind the accessors and asks the same question again.
An engine still returning the old answer has stopped tracking your records, and
its run reads are marked as a lower bound rather than printed as a result. lokijs
under clone: true is that case. An engine that reads nothing at any point, at
build or at query, is reported absent with the reason, never as a zero.
Accessors are slower than data properties. So the counted dataset is never the timed dataset. Two copies of the same rows, and no figure crosses between them.
Reading the clock
The counting axis is exact. Same seed, same integers, on any machine that can run the code: there is nothing to repeat, because repeating it reproduces it. The throughput axis is the opposite of that in every respect, and most benchmarks report the two as though they were the same kind of number.
One process cannot tell you how uncertain its own clock is. The
interquartile range across trials measures what varies inside a single
measurement, which is the least of what varies. Repeating a whole seven-trial
measurement eight times on this machine moved the median by 20.9% against a
printed IQR of 4.6%. So --replicates n runs the timing in n separate
processes, each with its own JIT history and its own moment in time, and the
table gets two columns: run to run, which is the one to read as uncertainty,
and IQR within a run, kept because a large gap between them is itself the
finding.
A replicate times and does nothing else. It does not repeat the index search or the toll pass, which saves the minutes but is not why: the toll pass hands every engine rows whose fields are accessors, and going first leaves the JIT holding inline caches for exactly the code about to be timed on a different shape.
Two engines are ordered by a paired sign test, not by a threshold. Both arms
are measured inside the same replicate, so they share whatever that process and
that moment did to the machine, and the sign of the difference is the part that
survives it. Under the null that they are the same speed each replicate is a coin
flip, so agreement across all k of them has p = 2^(1-k), no assumption about
the distribution required. Unanimity is the whole rule: an engine that lost even
one replicate has not been shown to be faster. Each table says how many of its
pairs the replicates order, names the ones they do not, and prints how many
orderings a table that size gets for free at that replicate count.
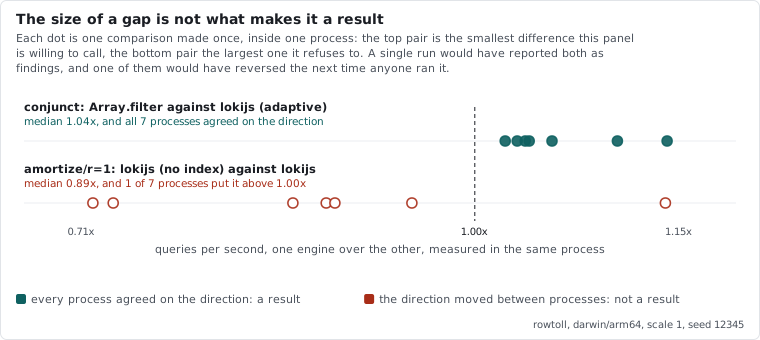
That rule replaced a constant, and the constant is why. This README used to tell you to disbelieve a throughput gap under roughly 1.25x. Then three whole runs of the panel on one machine put a single pairing at 1.6x one way, 1.8x the other and 1.5x back, all three past that constant, while the reads on it came out identical to the read every time.
A threshold cannot express that, and it is wrong in the other direction too. On
the run in this repository the replicates order 324 of the 351 pairs the panel
asks about, and the smallest difference they are willing to call is 4.0%,
seven processes out of seven agreeing that Array.filter beats an incrementally
indexed lokijs on the three-predicate workload. The largest they refuse is
12.3%, on a pairing that went the other way in six of the seven. Both of
those sit under the constant this replaced, which would have thrown away the
first and been silent about the second. Which one a pair is cannot be read off
its size.
The machine is part of the measurement, so the report prints it: the CPU, the cores, the memory, and a calibrator, a fixed two-million-row scan read before every workload in every replicate. It gives a unit a figure can be divided by to survive the trip to another machine, it says whether the machine changed speed while the replicate ran, and its own spread across replicates is the smallest difference this environment can resolve at all. Building its rows per call rather than once made it report the harness's own growing heap as the machine slowing down by 43.9%, which is the kind of thing an instrument does when nobody points an instrument at it.
The ceiling
The efficiency reference is the best index set that exists for the workload, found by building and running every candidate set up to a cap. Not a formula: a number computed on the actual data with the actual queries, the same way Belady's optimal replacement policy is computed on an actual trace.
Like Belady's, it is allowed to know things a real engine cannot. Its planner is handed the true selectivity of every predicate, computed by the oracle. That is the point: an engine scoring near it has left almost nothing on the table.
Also like Belady's, it binds only where it binds, and the report says where:
- It is optimal within a disclosed strategy space: scan, hash lookup, sorted range, posting-list intersection, and residual filtering in true-selectivity order. An engine with a strategy it does not have can legally pay less.
- For one family it is the information-theoretic floor: a single equality predicate served by a hash index reads no record at all, so the toll is the build and nothing more.
- The search is exact, not sampled. A candidate set whose build cost alone already exceeds the best total so far cannot win however its queries go, so it is skipped. The report prints how many sets were run, how many were skipped, and whether one more index than the cap allows would actually have been cheaper, which is asked by searching rather than by guessing.
What it found
Three results changed the design of the harness itself, so they are stated here rather than buried in a table. Every figure below is drawn from the run in the panel report, by a script that reads the same JSON, so a number in a picture and a number in a table cannot drift apart.
On the reads axis, indexing has almost no losing region. Building a hash index costs exactly one pass over a field, which is exactly what the scan it replaces costs, so it pays for itself on the second query at every scale measured. There is no crossover even at 100% selectivity, where an index still reads nothing at all.
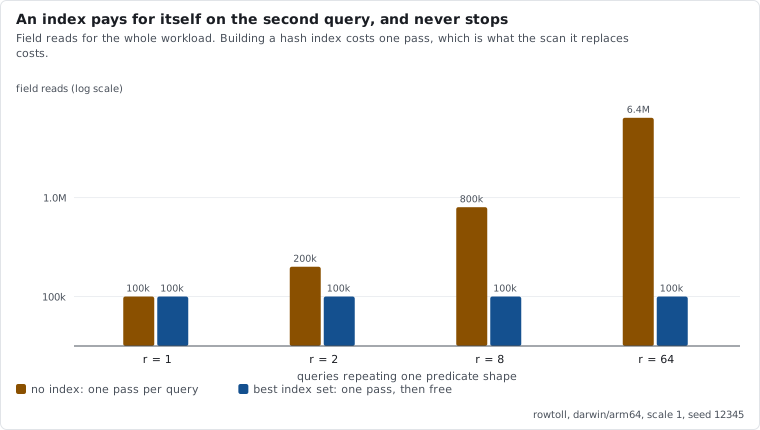
The worst loss available is one wasted pass per index that cannot serve the query, which is 1 + k/Q for k useless indexes and Q queries. Measured: 2.00x at one query and one wasted index, 3.00x at one query and two, 1.20x at ten queries and two, 1.01x at two hundred. The hostile case is real and it is a corner.
That is why the toll includes the build. An axis counting only query reads would have concluded that indexing everything is free, which is the flattering conclusion a benchmark exists to avoid.
The two axes disagree, and that is the interesting part. Widen a range until it keeps the whole collection, one engine with its best index declared against the same engine with nothing declared: the reads advantage decays from 2.11x to 1.38x, exactly and reproducibly. The clock advantage decays faster and runs out first. It starts at 1.77x, and at the top of the sweep the seven replicates no longer agree on which of the two is even faster, so the index ends up saving better than a quarter of the reads and buying no speed this instrument can find. A sorted index hands back positions in value order, so the residual filter walks the rows in random order while a scan walks them sequentially.
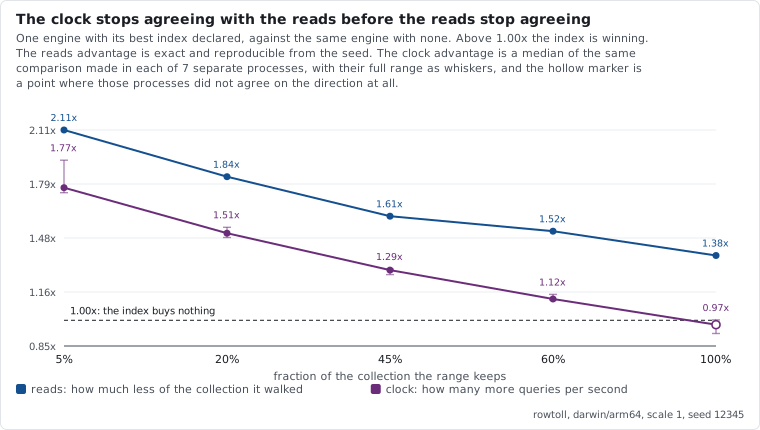
A harness reporting one number per workload would have to pick which axis to believe, and picking is not neutral. Both are printed, side by side.
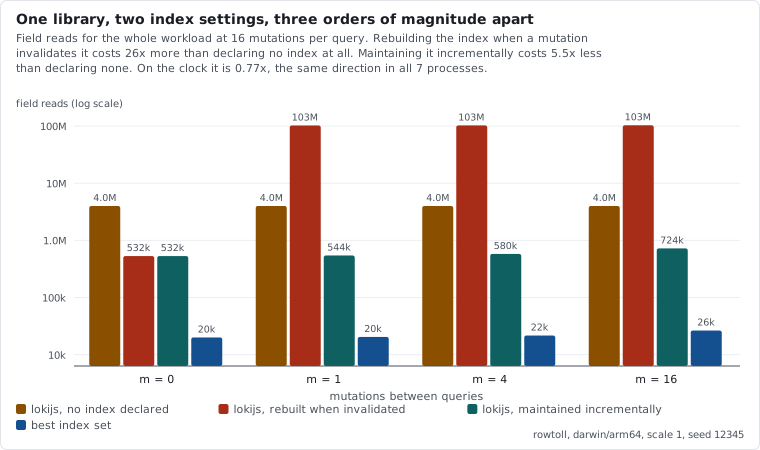
Where the real losses live is mutation, and the spread between two settings of the same library is three orders of magnitude. At sixteen mutations per query, one lokijs configuration pays 103,398,091 field reads and the other pays 723,980, a factor of 143. The first is 26x worse than the same library with no index declared at all, on reads and on the clock alike, by a margin no amount of noise reaches. The second is the interesting one: 5.5x better than it on reads and slower than it on the clock, in every replicate. The two axes name different winners there, which is what having two axes is for.
What the toll cannot see
It counts field reads. It does not count anything else, and the honest version of that sentence is that an engine can do an enormous amount of work without reading a single field.
The clearest case is in the panel. Under heavy mutation, maintaining a sorted index means splicing into arrays, which is memory traffic and no field access at all. Reads say the incrementally maintained lokijs is 5.5x better than the same library with no index, exactly and identically on every run from this seed, and the clock says it is the slower of the two, in every one of the seven replicates. Neither axis is wrong. The gap between them is the work the meter cannot see, and it is why "which engine won" is not a question this harness answers on its own.
The same blind spot covers memory. There is no byte instrument here, so there is no bytes column: a quantity with no instrument is absent, not zero. An index that doubles resident size and saves one read per query looks free on this axis.
And the clock stays the weaker axis even with the replicates under it. It reports what a difference did on one machine over half an hour, not what it is; the sign test says whether a direction held, never how much a reader should care; and the whole apparatus is there because the naive version of this axis was wrong in a way nothing inside a single process could reveal. The reads axis needs none of it: same seed, byte-identical output.
The panel
Sweeps, not verdicts. Every question here has a crossover, and a crossover reported as a single point is an opinion.
| workload | the parameter | what it is for |
|---|---|---|
| amortize/r= | repeats of one predicate shape | where an index starts paying |
| select-eq/s= | selectivity, from one row in the collection to all of them | the crossover that is not there |
| select-rng/keep= | fraction kept by a range | where the clock stops agreeing with the reads |
| churn/m= | mutations per query | the axis with the most loss available |
| hash-trap | equality queries, then ranges on the same field | the wasted-index loss, the only reads loss there is |
| skew | Zipf values, hottest against coldest | one average describes no query that runs |
| in-values | membership | the operator only a hash index serves |
| mixed-types | a column of numbers, strings and booleans | does an index change the answer? |
| conjunct | three predicates, no index worth building | which one gets tested first |
The panel ships with Array.filter as the baseline, plus sift, mingo and
three lokijs arms. Install the ones you want; whatever is present is what runs.
The three lokijs arms are not tuning. adaptiveBinaryIndices is two different
engines under mutation: off, the index is rebuilt on the next query after
anything changes; on, it is maintained incrementally at 32x the load cost. A
harness has no business picking one of those silently.
Every workload prints the true selectivity of its queries, the spread, and how many came back empty, all measured from the oracle's own answers. A small run with a high-cardinality field returns nothing for a large share of its queries, and an empty answer is where an index wins by the widest possible margin. That artifact is visible in the table rather than designed away.
Bringing your own
import { adapter, competitors, defaultWorkloads, runAll, markdownReport } from "rowtoll";

const mine = adapter({
  name: "mine",
  selfIndexing: true,          // handed no declared indexes: it has to find them
  make: (rows) => new MyCollection(rows),
});

const results = runAll(defaultWorkloads(), [...(await competitors()), mine]);
A subject is a name and a make(rows, indexes) returning something with
find(query), and optionally insert and remove. The declared index set comes
from the harness, identically for every engine, so nobody gets a configuration
the others did not. Mark a subject selfIndexing and it is handed nothing: it is
then measured against perfect foresight rather than against a plausible guess.
Refuse what you cannot express by throwing Unsupported. A refusal is a
first-class result: the cell prints as absent with the reason, never as a zero
and never as a correctness failure. An engine that cannot answer a query has not
answered it wrongly.
To publish a clock figure about your own engine, run the same protocol from your own bench script. The parent measures the deterministic axis once and hands the timing to fresh processes; a child recognizes itself by two environment variables and serves the plan.
// A replica times what its parent asked for, writes it, and prints nothing.
if (serveReplica(workloads, subjects)) process.exit(0);

const results = runAll(workloads, subjects, { trials, tollOnly: replicates > 1 });
if (replicates > 1) {
  const plan = planFrom(results, workloads, { scale, seed, trials });
  applyReplicas(results, spawnReplicas(plan, { replicates }));
}
spawnReplicas re-runs the current command line by default, so whatever started
the parent starts each child, including a TypeScript runner.
The query language
The harness owns it, and every adapter translates it. A panel where each engine gets asked in its own dialect is comparing dialects.
type Predicate =
  | { field: string; op: "eq"; value: FieldValue }
  | { field: string; op: "in"; values: FieldValue[] }
  | { field: string; op: "lt" | "lte" | "gt" | "gte"; value: number };

type Query = { where: Predicate[] };   // implicit AND, empty matches everything
Small on purpose. It is the smallest language in which choosing an index is a
real decision, and the surface where the incumbents already agree, so a
disagreement is about access paths rather than about who implements $regex.
Two translations that look obvious are silently wrong, and both are handled:
{ age: { $gte: 10, $lte: 20 } } makes lokijs read the first key and drop the
rest (11,000 rows becomes 90,000, and swapping the keys gives 21,000), and
merging several predicates on one field into one object literal loses all but the
last before any library sees it. One clause per predicate under an explicit
$and, always.
When not to use this
You want to know which is faster. This is not a speed benchmark, and the axis
it leads with is not a clock. tinybench,
mitata and
benchmark.js exist to time a
function properly, and one of them is the right tool when throughput is the
question. There is a clock here, under seven processes and a sign test, and it
is still deliberately the weaker of the two axes.
You want to know where your own program spends its time. A profiler answers
that: node --prof, --cpu-prof, or clinic.
They tell you where the time went. This tells you what a query cost in rows
walked, which is a different question and a portable one.
There is a real database in front of your data. Then you already have this
number, and better versions of it: EXPLAIN, the slow log, Rows_examined.
This package exists because in-memory JavaScript is the one place with none of
that.
Your workload needs a query language. Equality, membership and ranges under
an implicit and, and nothing else. No or, no regular expressions, no sort, no
projection, no aggregation, no joins. If your queries live outside that, this
panel cannot express your workload, and what it would tell you about your engine
would be about a workload you do not run.
You need bytes. There is no memory instrument here, so there is no memory column, and an index that doubles resident size to save one read per query looks free.
One more thing worth being straight about, because it is half the pitch. That no in-memory JavaScript collection reports rows examined comes from having gone looking and not found one, not from a survey anybody else can check. The other half, that every database reports it, is easy to verify and true. If you know a JavaScript collection that does report it, that is worth an issue: it would make this package smaller, which for a package like this one is a good outcome.
License
MIT