rum-client-js
v1.1.9
Published
A light weighted client side library to enable RUM(Real User Monitoring) for web applications
Downloads
69
Maintainers
 pushkar.goel
Readme
A light weighted client side library to enable RUM(Real User Monitoring) for web applications.
Installation
Using npm:
$ npm i --save rum-client-jsMotivation
- How will you compare how my application is performing on different browsers and their versions.
- Which resources are blocking my main thread and increasing first paint/interaction time?
- Are my resources properly encoded and compressed before sending to client?
- How to monitor application performance post deployments? Many more..
Quick Start
// Load the script's in the head section of the page
<script src="./path-to-script/rum-client-js/dist/rum-client.min.js"></script>
<script type="application/javascript">
    let RUMObject = new TrackPerformance({
        trackUrl: `${window.location.origin}/api/track`, // Endpoint at which collected data is sent
        batchSize: 50, // max entry batch size sent to server
        threshold: 3000, // in ms
        includeHosts: [ // consider entries from these hosts only
            'myapp.com'
        ],
        excludeHosts: [ // skip entries from these hosts (only works if includeHosts is not given)
            'fonts.googleapis.com',
            'themes.googleusercontent.com',
            'fonts.gstatic.com',
            'googletagmanager.com',
            'google-analytics.com'
        ],
        parserCb: (entry) => {
            // if you want to edit/add extra parameters to each entry
            return entry;
        },
        filterCb: (entry) => {
            // if you want to skip entry collection based on some condition
            return true;
        },
        addAdditionalData: () => {
            // if you want to add common tags for all entries
            return {
                tags: {
                    "user-agent": navigator.userAgent,
                    "app-version": "1.0.0"
                }
            };
        },
        excludeKeys: ['nextHopProtocol', 'initiatorType'] // exclude keys from each entry
    });

    // If you want to stop tracking manually, use below code
    // RUMObject.stop();
</script>
Save Your Sweat
Library internally compute and expose below mentioned metrics for each entry.
1. DNS Time - entry.dnsTime
2. Connection time - entry.connectionTime
3. TLS time - entry.tlsTime
4. Time to First Byte (TTFB) - entry.ttfb
5. Fetch Time - entry.fetchTime
6. Worker Time - entry.workerTime
7. Total Time entry.totalTime
8. Download Time - entry.downloadTime
9. Header Size - entry.headerSize
10. Compression Ratio - entry.compressionRatio
11. DOM Content Load Time - entry.DOMContentLoadTime // For entry.entryType === "navigation"
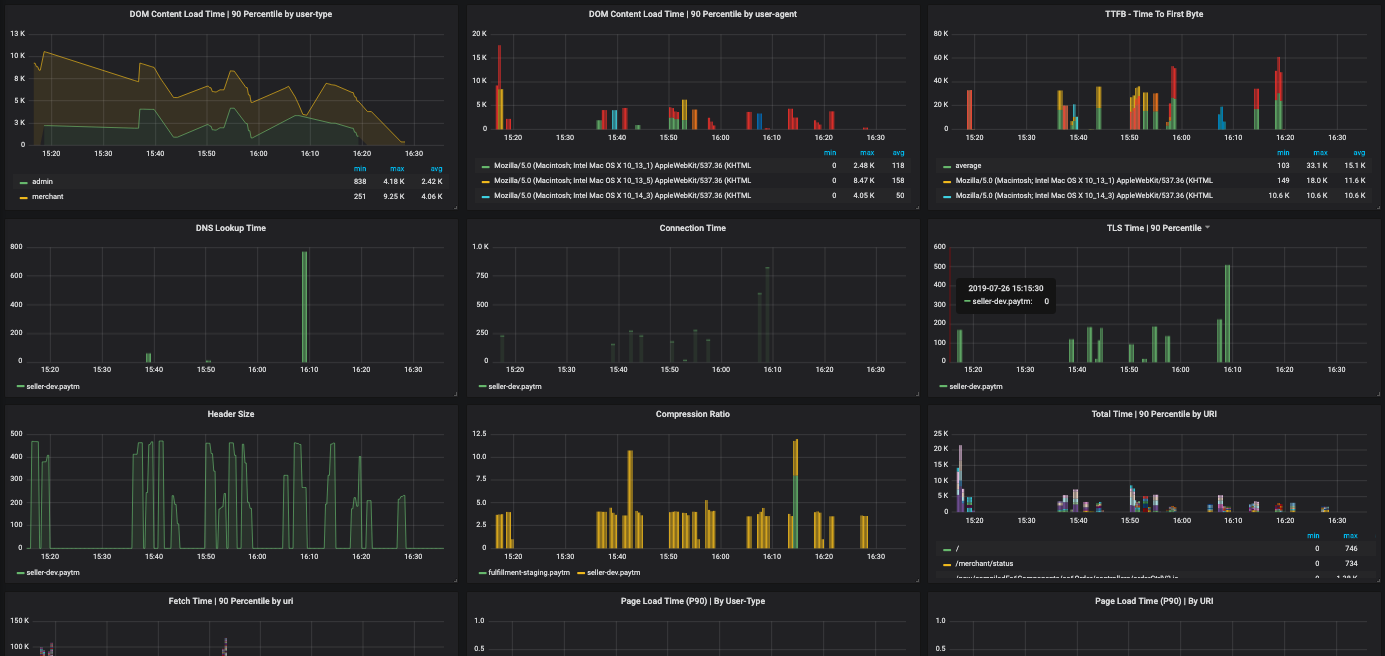
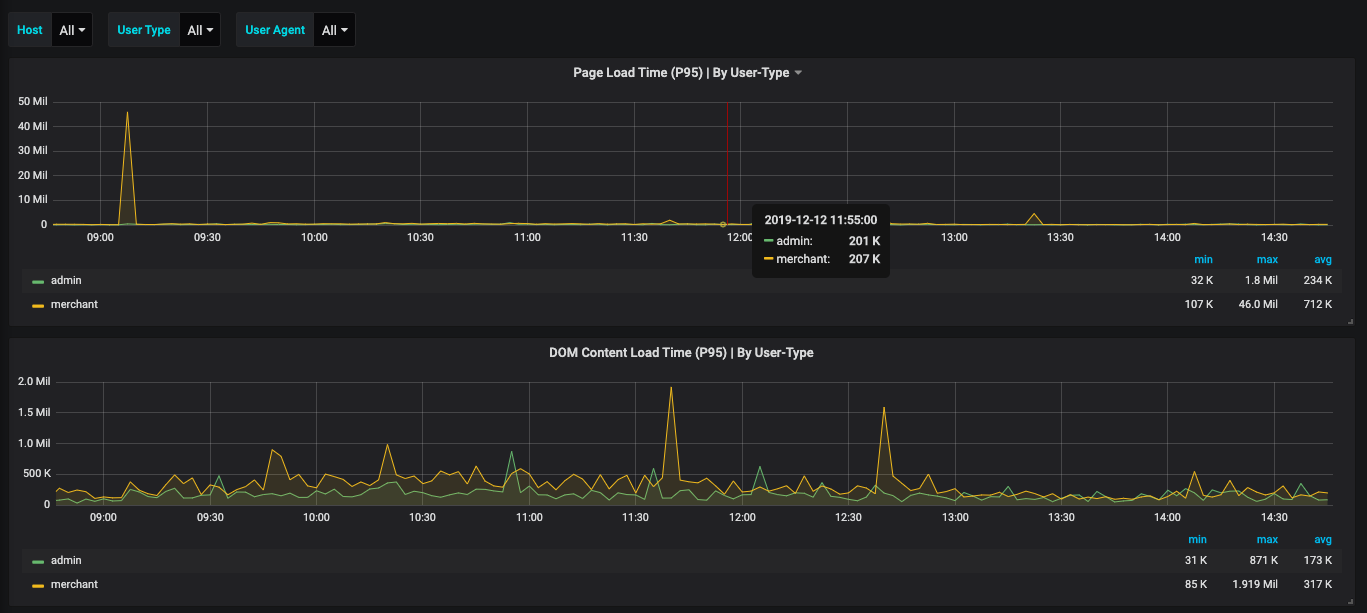
12. Page Load Time - entry.pageLoadTime // For entry.entryType === "navigation"Monitor Metrics
The collected data will be available at the configured URL (trackUrl). You can use the data points to create UI as per requirements. Below is one such implementation where I have piped the data points to a Data Source(Prometheus) and plotted the metrics against a UI(Grafana)