
safety-results-over-time
v2.3.3
Published
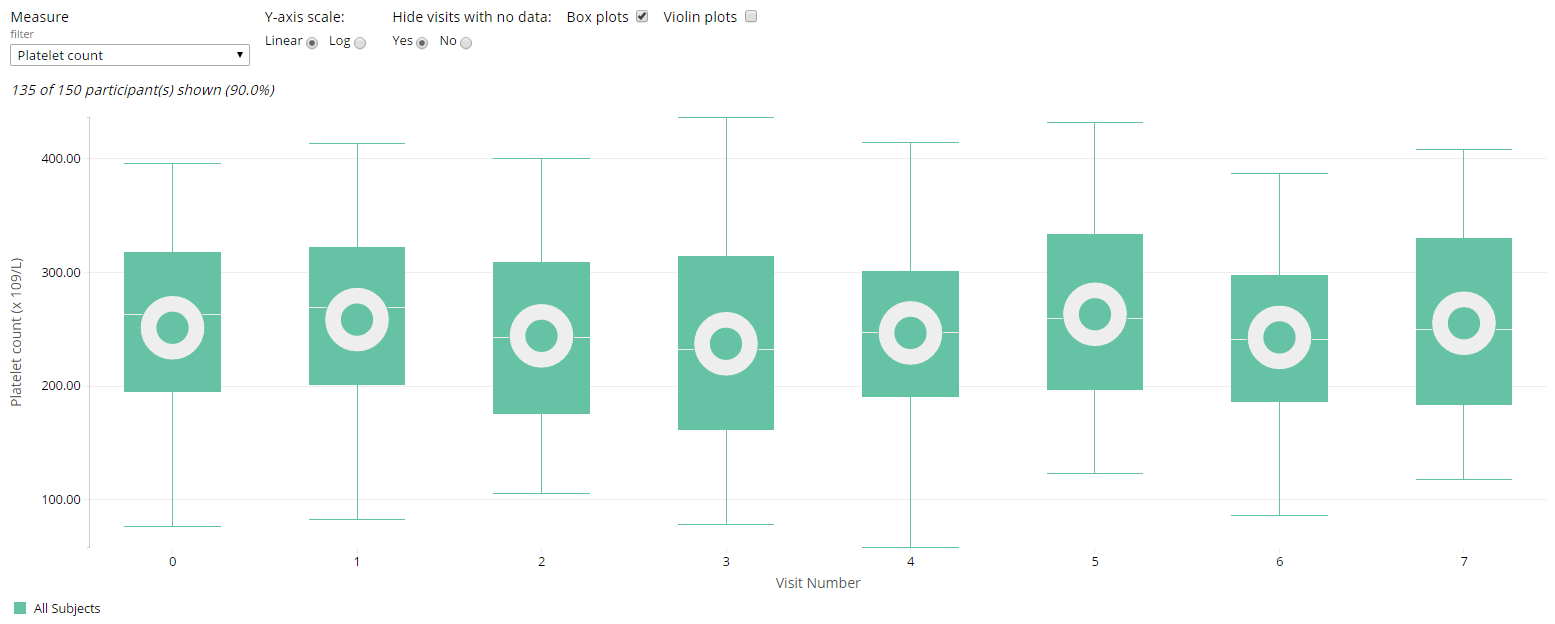
Chart showing population averages for lab measures, vital signs and other related measures during the course of a clinical trial.


Readme
Safety Results Over Time
Overview
Safety Results Over Time is a JavaScript library built using Webcharts (1, 2) that allows users to view summaries of clinical outcomes such as lab results and vital signs over time. A typical chart created with safety results over time looks like the chart pictured above. Users can specify grouping variables and overlay violin plots:
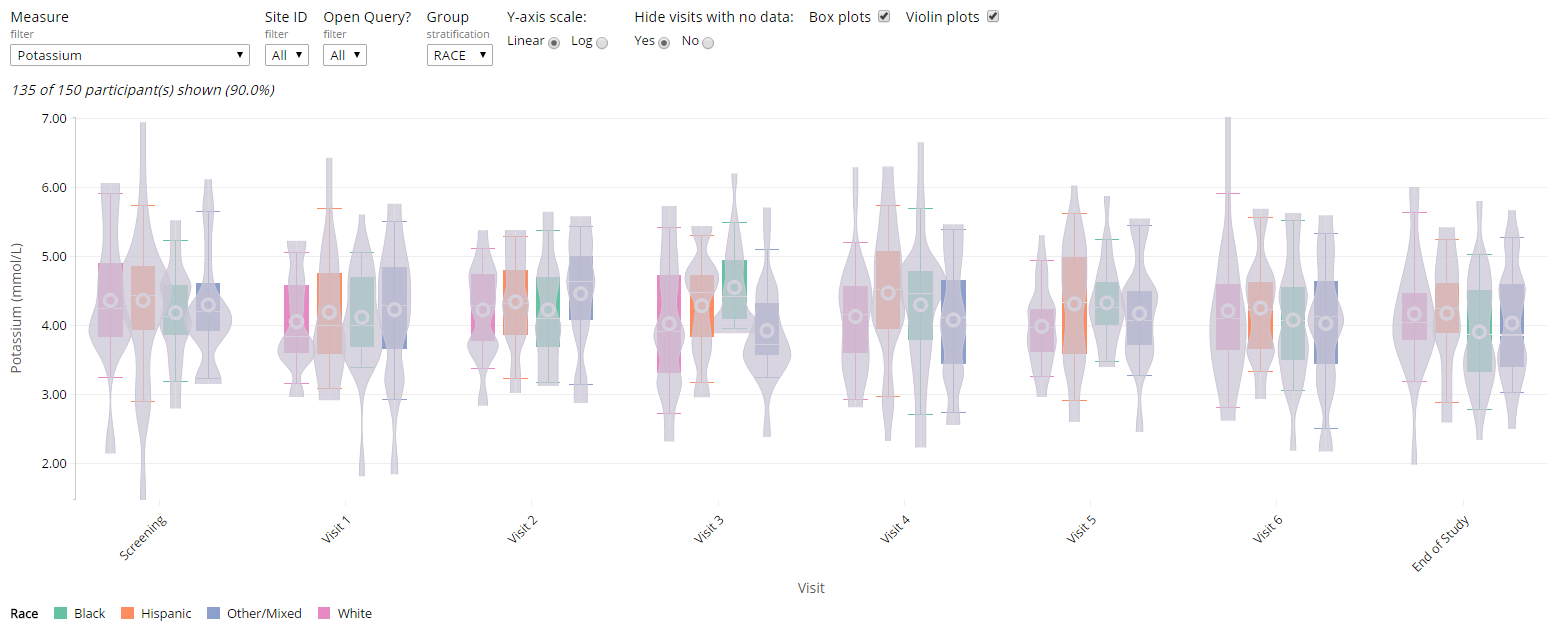
Users can view any outcome in the data and stratify that outcome by sex or treatment, for example; the full functionality is described here. The library expects an ADaM-esque data structure by default but can be customized to use any dataset that is one row per participant per timepoint per measure. Full details about chart configuration are here.
Users can interact with the display in real time to:
- See the chart compare lab and vital sign values at different time points
- See the number and percentage of participants displayed in the current view (updates with each user interaction)
- Change the measure of interest, and see an updated chart
- Hide visits that do not include data
- View box plots within the chart
- Remove box plots from the chart
- View violin plots in the chart
- Remove violin plots in the chart
- Filter the shift plot for selected criteria, and see an updated chart (optional)
Typical Usage
The code to initialize the chart looks like this:
    d3.csv(
        'https://rawgit.com/RhoInc/viz-library/master/data/safetyData/ADBDS.csv',
        function(data) {
            safetyResultsOverTime('body', {}).init(data);
        }
    );
The chart can be configured to facilitate non-standard data formats and to alter the chart itself. Overwrite the defaults with a custom settings object like so:
    const settings = {
        time_settings: {
            value_col: 'AVISIT',
            type: 'ordinal',
            label: 'Visit',
            rotate_tick_labels: true,
            vertical_space: 100
        },
        measure_col: 'PARAM',
        value_col: 'AVAL',
        normal_col_low: 'ANRLO',
        normal_col_high: 'ANRHI',
        groups: [
            {value_col: 'TRT01P', label: 'Treatment Group'},
            {value_col: 'SEX', label: 'Sex'},
            {value_col: 'RACE', label: 'Race'}],
        ],
        filters: [
            {value_col: 'TRT01P', label: 'Treatment Group'},
            {value_col: 'SEX', label: 'Sex'},
            {value_col: 'RACE', label: 'Race'}
        ],
        violins: true
    };

    d3.csv(
        'ADBDS.csv',
        function(data) {
            safetyResultsOverTime('body', settings).init(data);
        }
    );
Click here to open an interactive example of the Safety Results Over Time.