
senangwebs-yield
v1.0.2
Published
A lightweight, dependency-free JavaScript library for creating simple data visualizations (bar, pie, and line charts) using custom HTML attributes or a JavaScript API.
Maintainers
 a-hakim
Readme
SenangWebs Yield (SWY)
A lightweight, dependency-free JavaScript library for creating beautiful data visualizations using HTML, CSS, and SVG. Define charts with custom HTML attributes or use the JavaScript API. Perfect for developers who need quick, professional-looking charts without the overhead of large charting libraries.
![]()
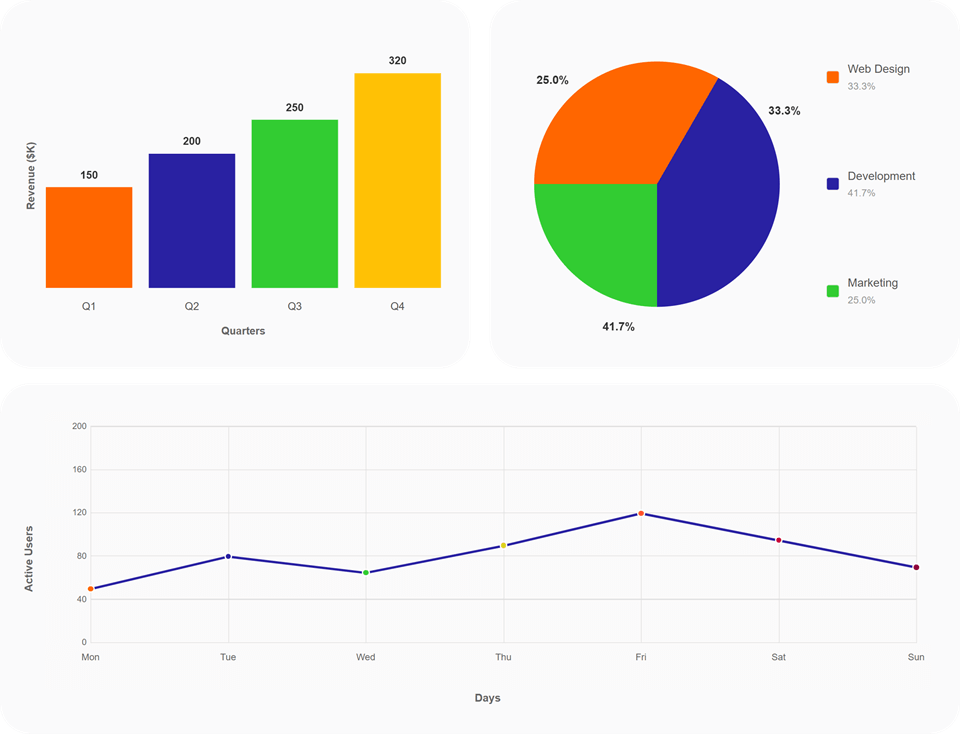
SenangWebs Yield Demo.
Features
- Lightweight - Zero external dependencies, vanilla JavaScript
- Modern Rendering - Uses HTML, CSS, and SVG instead of Canvas for better versatility and responsive design
- Declarative - HTML-first approach with
data-swyattributes - Flexible - JavaScript API for dynamic use cases
- Chart Types - Bar Chart, Pie Chart, Line Chart
- Customizable - Easy to style with CSS, no coding knowledge required
- Accessible - Semantic HTML elements for better accessibility
- Auto-initialization - Charts initialize automatically from HTML markup on page load
- Responsive Updates - Existing charts re-render after a debounced window resize
Installation
NPM
npm install senangwebs-yieldDirect Script Tag
<!-- Include both CSS and JS -->
<link rel="stylesheet" href="https://cdn.jsdelivr.net/npm/senangwebs-yield@latest/dist/swy.min.css">
<script src="https://cdn.jsdelivr.net/npm/senangwebs-yield@latest/dist/swy.min.js"></script>
Manual Download
Download swy.min.css and swy.min.js from the releases page and include them in your HTML:
<link rel="stylesheet" href="path/to/swy.min.css">
<script src="path/to/swy.min.js"></script>
Note: Both the CSS and JavaScript files are required for charts to render properly.
Quick Start
HTML API (Recommended)
Define charts directly in your HTML using data-swy attributes. Charts automatically initialize on page load!
<!DOCTYPE html>
<html>
<head>
    <link rel="stylesheet" href="path/to/swy.min.css">
</head>
<body>
    <!-- Bar Chart -->
    <div data-swy>
        <div data-swy-type="bar-chart"
             data-swy-x-axis="Company"
             data-swy-y-axis="Sales">
            <div data-swy-x-label="Company A" data-swy-y-value="150" data-swy-color="#ff6600"></div>
            <div data-swy-x-label="Company B" data-swy-y-value="200" data-swy-color="#2a22a2"></div>
            <div data-swy-x-label="Company C" data-swy-y-value="250" data-swy-color="#33cc33"></div>
        </div>
    </div>

    <!-- Pie Chart -->
    <div data-swy>
        <div data-swy-type="pie-chart" data-swy-total="360">
            <div data-swy-label="Product X" data-swy-value="120" data-swy-color="#ff6600"></div>
            <div data-swy-label="Product Y" data-swy-value="90" data-swy-color="#2a22a2"></div>
            <div data-swy-label="Product Z" data-swy-value="150" data-swy-color="#33cc33"></div>
        </div>
    </div>

    <!-- Line Chart -->
    <div data-swy>
        <div data-swy-type="line-chart"
             data-swy-x-axis="Day"
             data-swy-y-axis="Visitors">
            <div data-swy-x-label="Monday" data-swy-y-value="50"></div>
            <div data-swy-x-label="Tuesday" data-swy-y-value="80"></div>
            <div data-swy-x-label="Wednesday" data-swy-y-value="65"></div>
            <div data-swy-x-label="Thursday" data-swy-y-value="90"></div>
        </div>
    </div>

    <script src="path/to/swy.min.js"></script>
</body>
</html>
JavaScript API
For dynamic charts, data from APIs, or programmatic control:
<!DOCTYPE html>
<html>
<head>
    <link rel="stylesheet" href="path/to/swy.min.css">
</head>
<body>
    <!-- Empty containers for charts -->
    <div id="bar-chart-container"></div>
    <div id="pie-chart-container"></div>
    <div id="line-chart-container"></div>

    <script src="path/to/swy.min.js"></script>
    <script>
        // Bar Chart
        SWY.initBarChart({
            container: '#bar-chart-container',
            xAxis: 'Month',
            yAxis: 'Revenue ($K)',
            data: [
                { xLabel: 'January', yValue: 300, color: '#ff6600' },
                { xLabel: 'February', yValue: 400, color: '#2a22a2' },
                { xLabel: 'March', yValue: 500, color: '#33cc33' }
            ]
        });

        // Pie Chart
        SWY.initPieChart({
            container: '#pie-chart-container',
            total: 500, // Optional, auto-calculated if omitted
            data: [
                { label: 'Service A', value: 200, color: '#ff6600' },
                { label: 'Service B', value: 150, color: '#2a22a2' },
                { label: 'Service C', value: 150, color: '#33cc33' }
            ]
        });

        // Line Chart
        SWY.initLineChart({
            container: '#line-chart-container',
            xAxis: 'Week',
            yAxis: 'Sales',
            data: [
                { xLabel: 'Week 1', yValue: 100 },
                { xLabel: 'Week 2', yValue: 150 },
                { xLabel: 'Week 3', yValue: 200 },
                { xLabel: 'Week 4', yValue: 250 }
            ]
        });

        // Fetch data from API and create chart
        fetch('/api/chart-data')
            .then(response => response.json())
            .then(data => {
                SWY.initBarChart({
                    container: '#api-chart',
                    xAxis: 'Category',
                    yAxis: 'Value',
                    data: data.items
                });
            });
    </script>
</body>
</html>
Chart Types
Bar Chart
Display categorical data with vertical bars.
HTML Attributes:
data-swy-type="bar-chart"- Chart typedata-swy-x-axis- X-axis labeldata-swy-y-axis- Y-axis labeldata-swy-x-label- Individual bar labeldata-swy-y-value- Bar value (numeric)data-swy-color- Optional bar color
JavaScript Options:
{
    container: '#element-id',
    xAxis: 'Category Label',
    yAxis: 'Value Label',
    data: [
        { xLabel: 'Label', yValue: 100, color: '#ff6600' }
    ]
}
Pie Chart
Display proportional data as pie slices.
HTML Attributes:
data-swy-type="pie-chart"- Chart typedata-swy-total- Total value for percentagesdata-swy-label- Slice labeldata-swy-value- Slice value (numeric)data-swy-color- Optional slice color
JavaScript Options:
{
    container: '#element-id',
    total: 100, // Optional, auto-calculated if omitted
    data: [
        { label: 'Category', value: 30, color: '#ff6600' }
    ]
}
Line Chart
Display data trends over time or categories.
HTML Attributes:
data-swy-type="line-chart"- Chart typedata-swy-x-axis- X-axis labeldata-swy-y-axis- Y-axis labeldata-swy-x-label- Point label on x-axisdata-swy-y-value- Point value (numeric)data-swy-color- Optional point color
JavaScript Options:
{
    container: '#element-id',
    xAxis: 'Time Label',
    yAxis: 'Value Label',
    data: [
        { xLabel: 'Point 1', yValue: 100, color: '#33cc33' }
    ]
}
Customization
Default Colors
If no color is specified, charts use a predefined color palette:
#ff6600- Orange#2a22a2- Blue#33cc33- Green#ddd222- Yellow#ff5733- Red-Orange#c70039- Crimson#900c3f- Purple#FF69B4- Hot Pink
CSS Customization
Since charts are rendered with HTML and CSS, you can easily customize their appearance:
/* Customize bar chart colors */
.swy-bar-chart .swy-bar {
    transition: opacity 0.3s ease;
}

.swy-bar-chart .swy-bar:hover {
    opacity: 0.8;
}

/* Customize pie chart labels */
.swy-pie-chart .swy-legend-item {
    font-size: 14px;
    font-weight: bold;
}

/* Customize line chart */
.swy-line-chart .swy-line-path {
    stroke-width: 3;
}

/* Customize axis labels */
.swy-axis-label {
    font-size: 12px;
    color: #666;
}

/* Change chart container styling */
[data-swy] {
    background: #f9f9f9;
    border-radius: 8px;
    padding: 20px;
}
Responsive Design
Charts automatically resize to fit their container. Window resize events are debounced by 150ms, then existing HTML and JavaScript API charts re-render in place.
/* Make chart containers responsive */
[data-swy] {
    width: 100%;
    max-width: 800px;
    height: 400px;
}

/* For mobile devices */
@media (max-width: 768px) {
    [data-swy] {
        height: 300px;
    }
}
API Reference
Global SWY Object
The library exposes a global SWY object with the following methods:
SWY.initBarChart(options)
Initialize a bar chart programmatically. Initializing the same container again replaces its previously registered chart.
Parameters:
options.container(string) - CSS selector for the container elementoptions.xAxis(string) - Label for the X-axisoptions.yAxis(string) - Label for the Y-axisoptions.data(array) - Array of data points withxLabel,yValue, and optionalcolor
Returns: boolean - true if successful, false otherwise
Example:
SWY.initBarChart({
    container: '#my-chart',
    xAxis: 'Months',
    yAxis: 'Revenue ($K)',
    data: [
        { xLabel: 'Jan', yValue: 150, color: '#ff6600' },
        { xLabel: 'Feb', yValue: 200, color: '#2a22a2' }
    ]
});
SWY.initPieChart(options)
Initialize a pie chart programmatically.
Parameters:
options.container(string) - CSS selector for the container elementoptions.total(number, optional) - Total value for percentage calculation (auto-calculated if omitted)options.data(array) - Array of data points withlabel,value, and optionalcolor
Returns: boolean - true if successful, false otherwise
Example:
SWY.initPieChart({
    container: '#my-pie',
    data: [
        { label: 'Category A', value: 120, color: '#ff6600' },
        { label: 'Category B', value: 80, color: '#2a22a2' }
    ]
});
SWY.initLineChart(options)
Initialize a line chart programmatically.
Parameters:
options.container(string) - CSS selector for the container elementoptions.xAxis(string) - Label for the X-axisoptions.yAxis(string) - Label for the Y-axisoptions.data(array) - Array of data points withxLabel,yValue, and optionalcolor
Returns: boolean - true if successful, false otherwise
Example:
SWY.initLineChart({
    container: '#my-line',
    xAxis: 'Days',
    yAxis: 'Visitors',
    data: [
        { xLabel: 'Mon', yValue: 50 },
        { xLabel: 'Tue', yValue: 80 }
    ]
});
SWY.setDebugMode(enabled)
Enable or disable debug logging to the console.
Parameters:
enabled(boolean) -trueto enable debug mode,falseto disable
Example:
SWY.setDebugMode(true); // Enable debug logsSWY.reinitialize()
Re-render all registered charts and initialize any new declarative charts added after page load. Detached chart containers are removed from the internal registry.
Returns: void
Example:
// After changing a chart container's layout or adding new data-swy markup
SWY.reinitialize();
SWY.getVersion()
Get the current library version.
Returns: string - Version number (e.g., "1.0.2")
Example:
console.log('SWY Version:', SWY.getVersion());Browser Support
SWY works on all modern browsers that support HTML5, CSS3, and SVG:
| Browser | Version | |---------|---------| | Chrome | 60+ | | Firefox | 55+ | | Safari | 11+ | | Edge | 79+ | | Opera | 47+ | | Mobile Safari | iOS 11+ | | Chrome Mobile | Android 5+ |
Note: The library uses modern JavaScript features (ES6+) and CSS Flexbox/Grid. For older browser support, consider using transpilers and polyfills.
Development
Setup
Clone the repository and install dependencies:
git clone https://github.com/senangwebs/senangwebs-yield.git
cd senangwebs-yield
npm install
Development Server
Start the development server with hot reload:
npm run devThis will open the examples page at http://localhost:8080.
Build
Build the production-ready files:
npm run buildOutput files are created in the dist/ directory:
swy.min.js- Minified JavaScriptswy.min.css- Minified CSS
Run npm run build:dev to create the non-minified swy.js and swy.css files.
Development Build
Build without minification for debugging:
npm run build:devWatch Mode
Automatically rebuild on file changes:
npm run watchLint
Check code for style and quality issues:
npm run lintFix linting issues automatically:
npm run lint:fixFormat
Format code with Prettier:
npm run formatProject Structure
senangwebs-yield/
├── src/
│   ├── swy.js              # Main entry point
│   ├── charts/
│   │   ├── barChart.js     # Bar chart implementation
│   │   ├── pieChart.js     # Pie chart implementation
│   │   └── lineChart.js    # Line chart implementation
│   ├── styles/
│   │   └── charts.css      # Chart styling
│   └── utils/
│       ├── dom.js          # DOM utilities
│       ├── logger.js       # Logging utilities
│       ├── parser.js       # HTML attribute parser
│       └── validator.js    # Input validation
├── dist/                   # Built files (generated)
├── examples/               # Example HTML files
├── docs/                   # Documentation
└── webpack.config.js       # Build configuration
Use Cases
SenangWebs Yield is perfect for:
- Dashboards - Quick visualizations for admin panels and analytics dashboards
- Reports - Embedding charts in web-based reports
- Documentation - Adding charts to technical documentation
- Presentations - Interactive web-based presentations
- Educational Content - Teaching data visualization concepts
- Lightweight Projects - Where full-featured charting libraries are overkill
- No-Code Solutions - Content editors can add charts via HTML without JavaScript knowledge
Performance
- Small Bundle Size - About 32KB minified (JS + CSS combined)
- Fast Rendering - HTML/CSS rendering is faster than Canvas for simple charts
- Zero Dependencies - No jQuery, React, or other frameworks required
- Efficient Updates - Resize-driven re-renders are debounced and reuse registered chart instances
- Mobile Optimized - Smooth performance on mobile devices
Examples
Check out the /examples directory for complete working examples:
- index.html - Comprehensive showcase of all chart types
- HTML API examples
- JavaScript API examples
- Advanced examples with larger datasets
- Responsive design demonstrations
License
MIT License - see LICENSE.md for details
Contributing
Contributions are welcome! Please feel free to submit a Pull Request.
Guidelines
- Follow the existing code style (ESLint + Prettier)
- Add examples for new features
- Update documentation as needed
- Test on multiple browsers
- Keep the library lightweight and dependency-free