
serverless-graph
v0.3.2
Published
Serverless Graph - A serverless plugin for creating a graph usable by graphviz.


Readme
Serverless Graph
This project was adapted from CFVIZ. Serverless Graph outputs your serverless architecture and resources as a Graphviz dot compatible output. Currently only supports the AWS provider.
Note: Serverless v1.x.x or higher is required.
Example Output

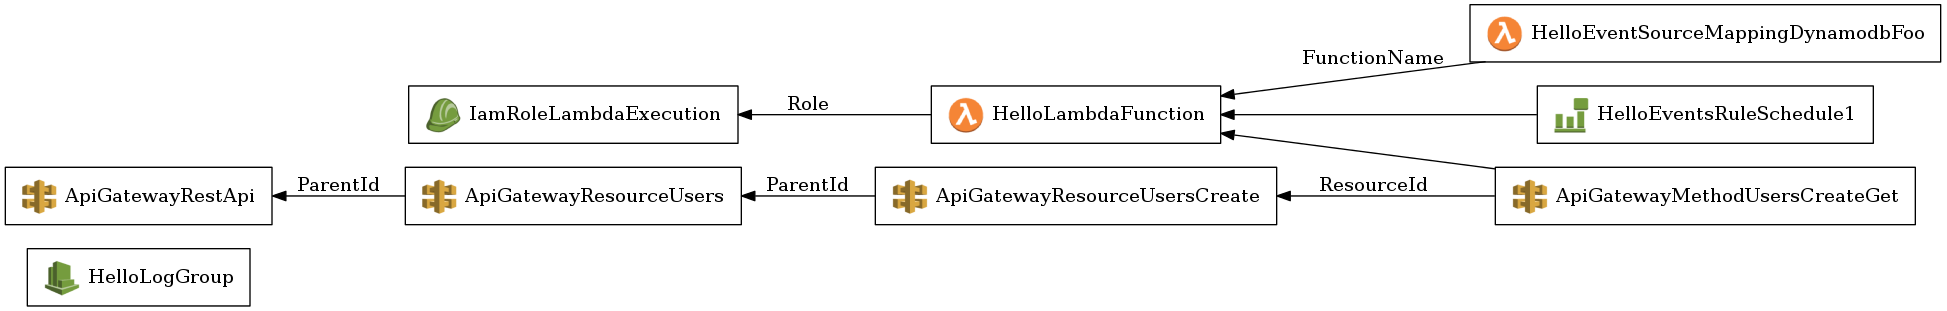
Clarity Mode Graph
We built in a "clarity" mode, that attempts to remove a lot of boilerplate serverless stuff (permissions, lambda versions, etc) in order to increase understanding. The above graph is show here in clarity mode.
Why?
Sometimes this is the fastest way to just visualize everything going on, it can also be extremely helpful in debugging circular dependency issues in CloudFormation templates.
Get Started
npm install --save serverless-graph- Install graphviz
- Homebrew - brew install graphviz
- Add serverless-graph to the plugins section of your serverless.yml
Run
If you have any commandline params that don't have defaults you will have to pass in any opt variables as this plugin hooks into the package step and then reads the output.
sls graph {--opts}- Output SVG
cat graph.out | dot -Tsvg -oexample.svg
- Output PNG
cat graph.out | dot -Tpng -oexample.png
- See Graphviz for more information.
Options (--help)
Plugin: ServerlessGraph
graph ......................... Creates graphviz compatible graph output of nodes and edges. Saves to graph.out file.
    --vertical ......................... Graph nodes from top down instead of left to right.
    --edgelabels / -e .................. Display edgelabels in graph.
    --clarity / -c ..................... By default we show everything, clarity mode will attempt to remove implied nodes and edges for a better graph
    --outFile / -o ..................... Output file, defaults to graph.out