
sf-kpi-dashboard
v1.0.0
Published
Salesforce KPI Dashboard Generator
Maintainers
 mohanchinnappan
Readme
🚀 Salesforce KPI Dashboard Generator
A powerful command-line tool that generates a comprehensive, interactive HTML dashboard showcasing key performance indicators (KPIs) and metrics from your Salesforce org.
✨ Features
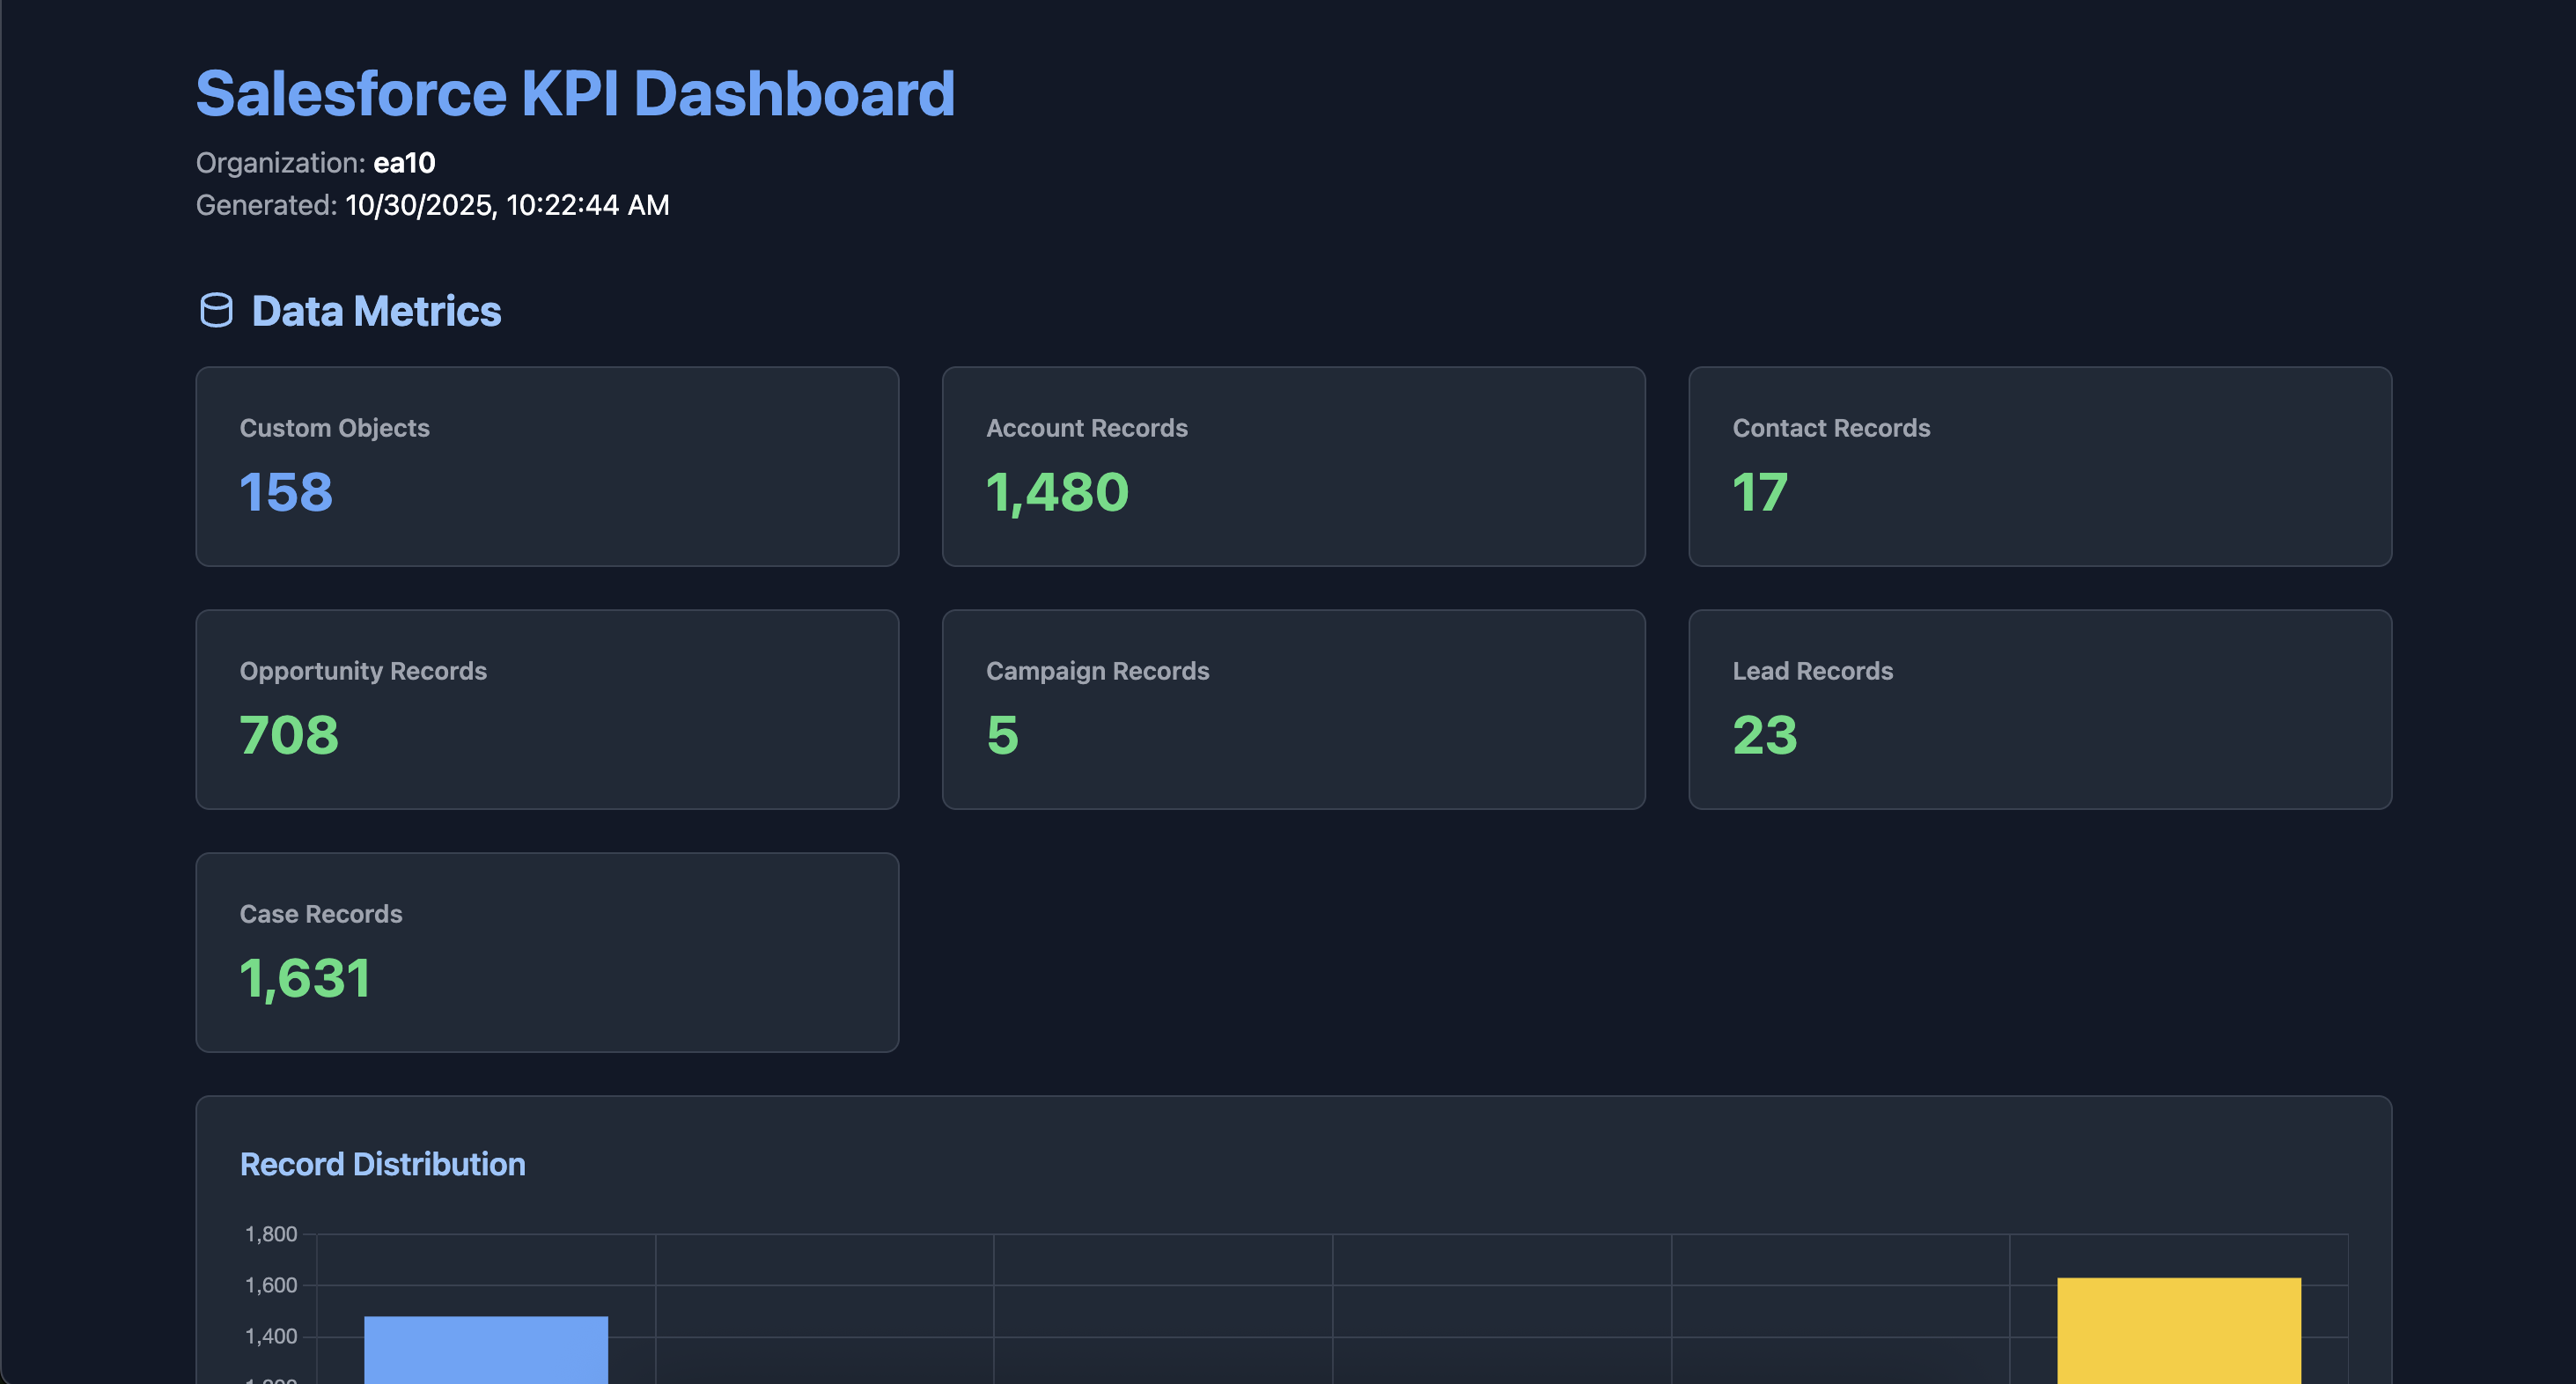
📊 Comprehensive Metrics Collection
- Data Metrics: Custom objects, Account, Contact, Opportunity, Campaign, Lead, and Case record counts
- Data Quality Analysis: Field population metrics to identify incomplete records
- Security & Access: Profile and permission set distribution with user assignments
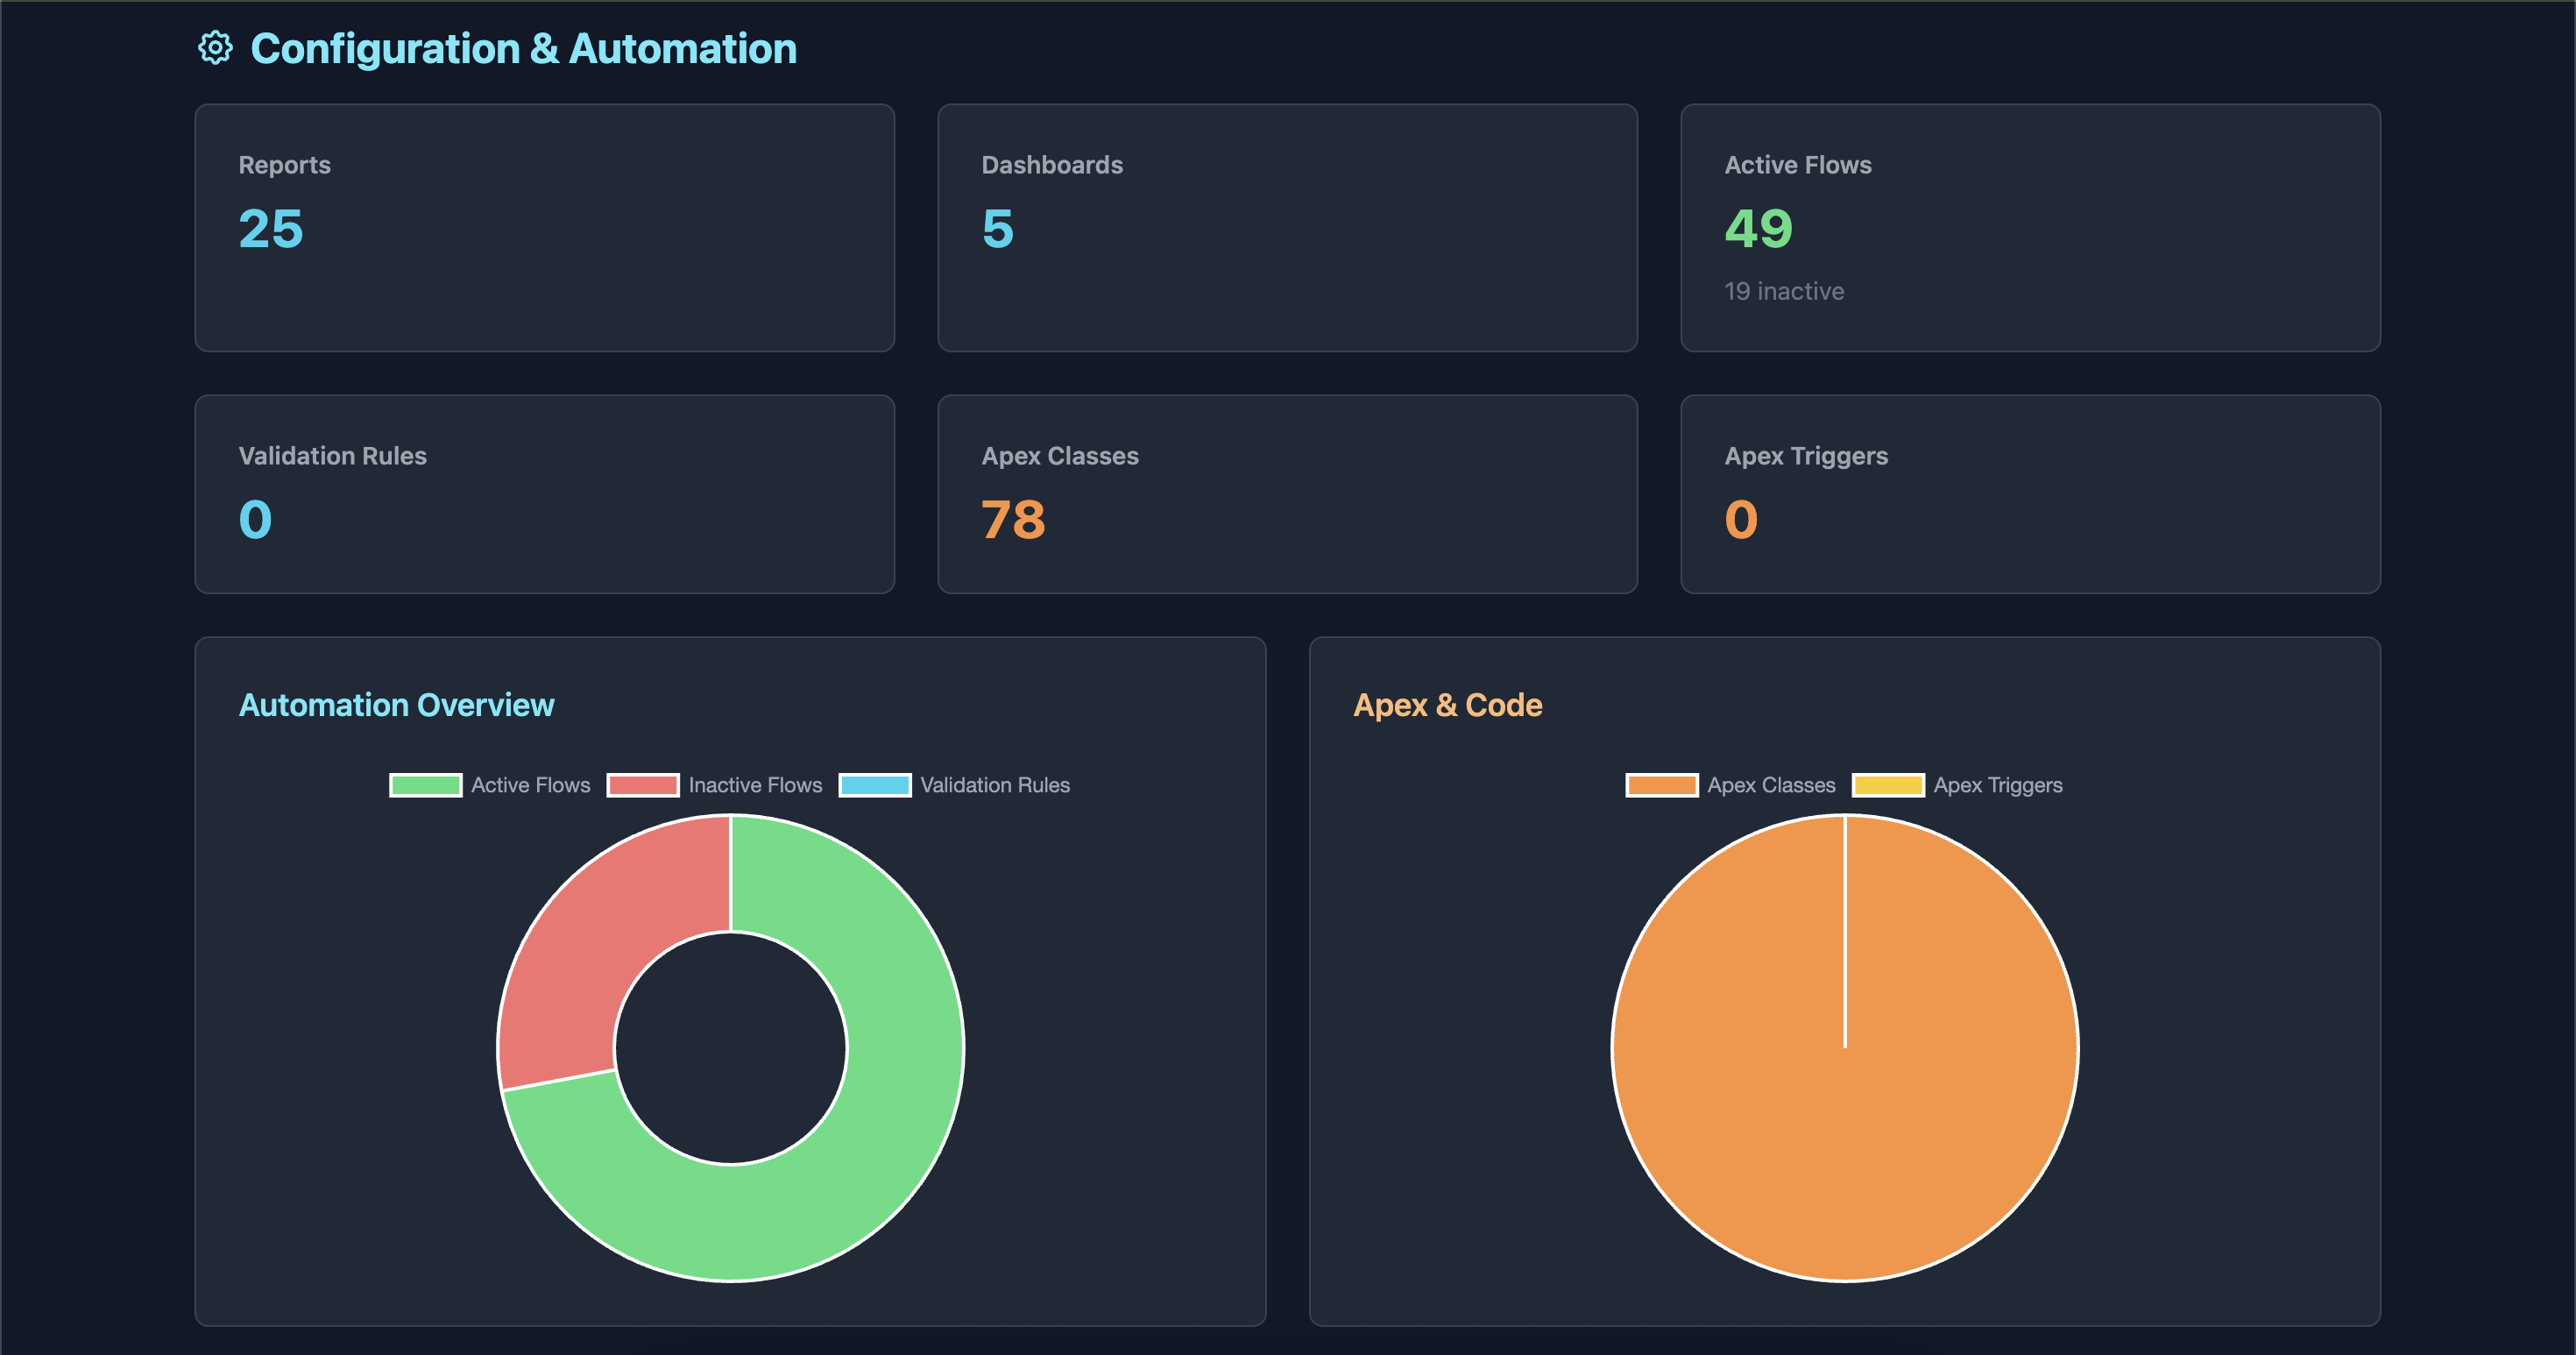
- Configuration & Automation: Reports, dashboards, flows, validation rules
- Code Metrics: Apex classes and triggers inventory
🎨 Interactive Dashboard
- Modern Dark Theme: Beautiful, eye-friendly interface using Tailwind CSS
- Real-time Search: Filter profiles and permission sets instantly
- Sortable Lists: Toggle between ascending/descending order
- Visual Charts: Interactive charts powered by Chart.js
- Record distribution bar chart
- Automation overview doughnut chart
- Apex code distribution pie chart
- Responsive Design: Works seamlessly on desktop, tablet, and mobile devices
🔍 Key Sections
- Data Metrics - Overview of record counts across standard objects
- Data Quality - Identify records with missing key fields
- Security & Access - User distribution by profiles and permission sets
- Configuration & Automation - Automation and reporting tools usage
🛠️ Prerequisites
- Node.js v14 or higher
- Salesforce CLI (
sf) installed and authenticated - Access to a Salesforce org
📦 Installation
Option 1: NPM Package (Recommended)
npm install -g sf-kpi-dashboard🚀 Usage
Basic Command
sf-kpi -o <username-or-alias>Examples
# Using org username
sf-kpi -o [email protected]

# Using org alias
sf-kpi -o myDevOrg

# Specify custom port (optional)
sf-kpi -o myDevOrg --port 8080
Command Options
| Option | Alias | Description | Required | Default |
|--------|-------|-------------|----------|---------|
| --org | -o | Salesforce org username or alias | ✅ Yes | - |
| --port | -p | Port for local server | ❌ No | 8080 |
| --help | -h | Display help information | ❌ No | - |
| --version | -V | Show version number | ❌ No | - |
📊 Dashboard Sections Explained
1. Data Metrics
Displays the total count of:
- Custom objects in your org
- Records across key standard objects (Account, Contact, Opportunity, Campaign, Lead, Case)
- Visual bar chart showing record distribution
2. Data Quality
Identifies records with missing critical fields:
- Accounts: Missing Phone, Industry, or Annual Revenue
- Contacts: Missing Phone, Email, or Title
- Opportunities: Missing Amount, Close Date, or Stage Name
3. Security & Access
Users by Profile
- Searchable and sortable list of all active user profiles
- Shows user count per profile
- Real-time filtering
Users by Permission Set
- Searchable and sortable list of permission sets
- Displays assignment count for each permission set
- Excludes profile-owned permission sets
4. Configuration & Automation
Tracks your org's automation and reporting tools:
- Reports and Dashboards count
- Active and inactive Flows
- Active Validation Rules
- Apex Classes and Triggers
- Visual charts for automation and code distribution
🎯 Use Cases
For Salesforce Administrators
- Org Health Check: Quick overview of data distribution and quality
- Security Audit: Review user access and permission assignments
- Automation Inventory: Track flows, validation rules, and custom code
For Salesforce Architects
- Technical Debt Assessment: Identify unused or inactive automation
- Capacity Planning: Understand data volume and growth patterns
- Documentation: Generate snapshots for architectural reviews
For Business Analysts
- Data Completeness: Identify data quality issues
- Adoption Metrics: Track record creation across objects
- Reporting Coverage: Assess reports and dashboards inventory
🔧 How It Works
- Authentication: Uses Salesforce CLI to retrieve access token
- Data Collection: Queries Salesforce REST and Tooling APIs
- Processing: Aggregates and organizes metrics
- Generation: Creates a standalone HTML file with embedded data
- Display: Automatically opens the dashboard in your default browser
📁 Output
The tool generates an HTML file named:
sf-kpi-dashboard-{timestamp}.htmlThe file is:
- ✅ Self-contained (no external dependencies except CDN resources)
- ✅ Shareable (send to stakeholders)
- ✅ Archivable (track changes over time)
- ✅ Printable (export to PDF from browser)
🐛 Troubleshooting
Authentication Errors
Error: Failed to get org informationSolution: Ensure you're authenticated to the org:
### API Errors
```bash
Error: Failed to fetch [metric]Solution: Check your user permissions. You need:
- View All Data (or View Setup and Configuration)
- API Enabled
Missing Data
If certain metrics show as "N/A":
- The object may not exist in your org
- You may lack permissions to query the object
- The object may have restricted access
📈 Performance
- Typical Runtime: 10-30 seconds depending on org size
- API Calls: ~15-20 API requests
- Memory Usage: < 100MB
- Output File Size: ~50-100KB
🔒 Security & Privacy
- ✅ No data is sent to external servers
- ✅ Access tokens are retrieved from Salesforce CLI
- ✅ All processing happens locally
- ✅ Generated HTML contains only metadata, not sensitive data
- ⚠️ Note: The generated HTML file contains org information. Handle with appropriate security measures.
Ideas for Contribution
- Add more KPI metrics
- Create additional chart types
- Export data to CSV/JSON
- Add historical tracking
- Create scheduling functionality
📝 License
MIT License
🗺️ Roadmap
- [ ] Export to PDF
- [ ] CSV data export
- [ ] Historical comparison
- [ ] Scheduled execution
- [ ] Email delivery
- [ ] Custom object support
- [ ] Multi-org comparison
- [ ] Integration with CI/CD pipelines
Made with ❤️ for the Salesforce Community