
sf-org-dashboard
v1.0.1
Published
Unified Salesforce Org Dashboard - Health, KPIs, and Visualization
Maintainers
 mohanchinnappan
Readme
Salesforce Org Dashboard
A unified CLI dashboard that integrates multiple Salesforce org analysis tools into a single, beautiful dark-themed web interface.
Features
- 🎨 Beautiful Dark Theme - Modern UI built with Tailwind CSS
- 📊 Three Analysis Tools in One:
- Org Health Check - Analyze org limits and health metrics
- KPI Dashboard - Key performance indicators
- Org Visualization - Visual org structure diagrams
- 🔄 Real-time Updates - Auto-refreshing status indicators
- 📱 Responsive Design - Works on all screen sizes
- 🚀 Easy to Use - Simple CLI interface
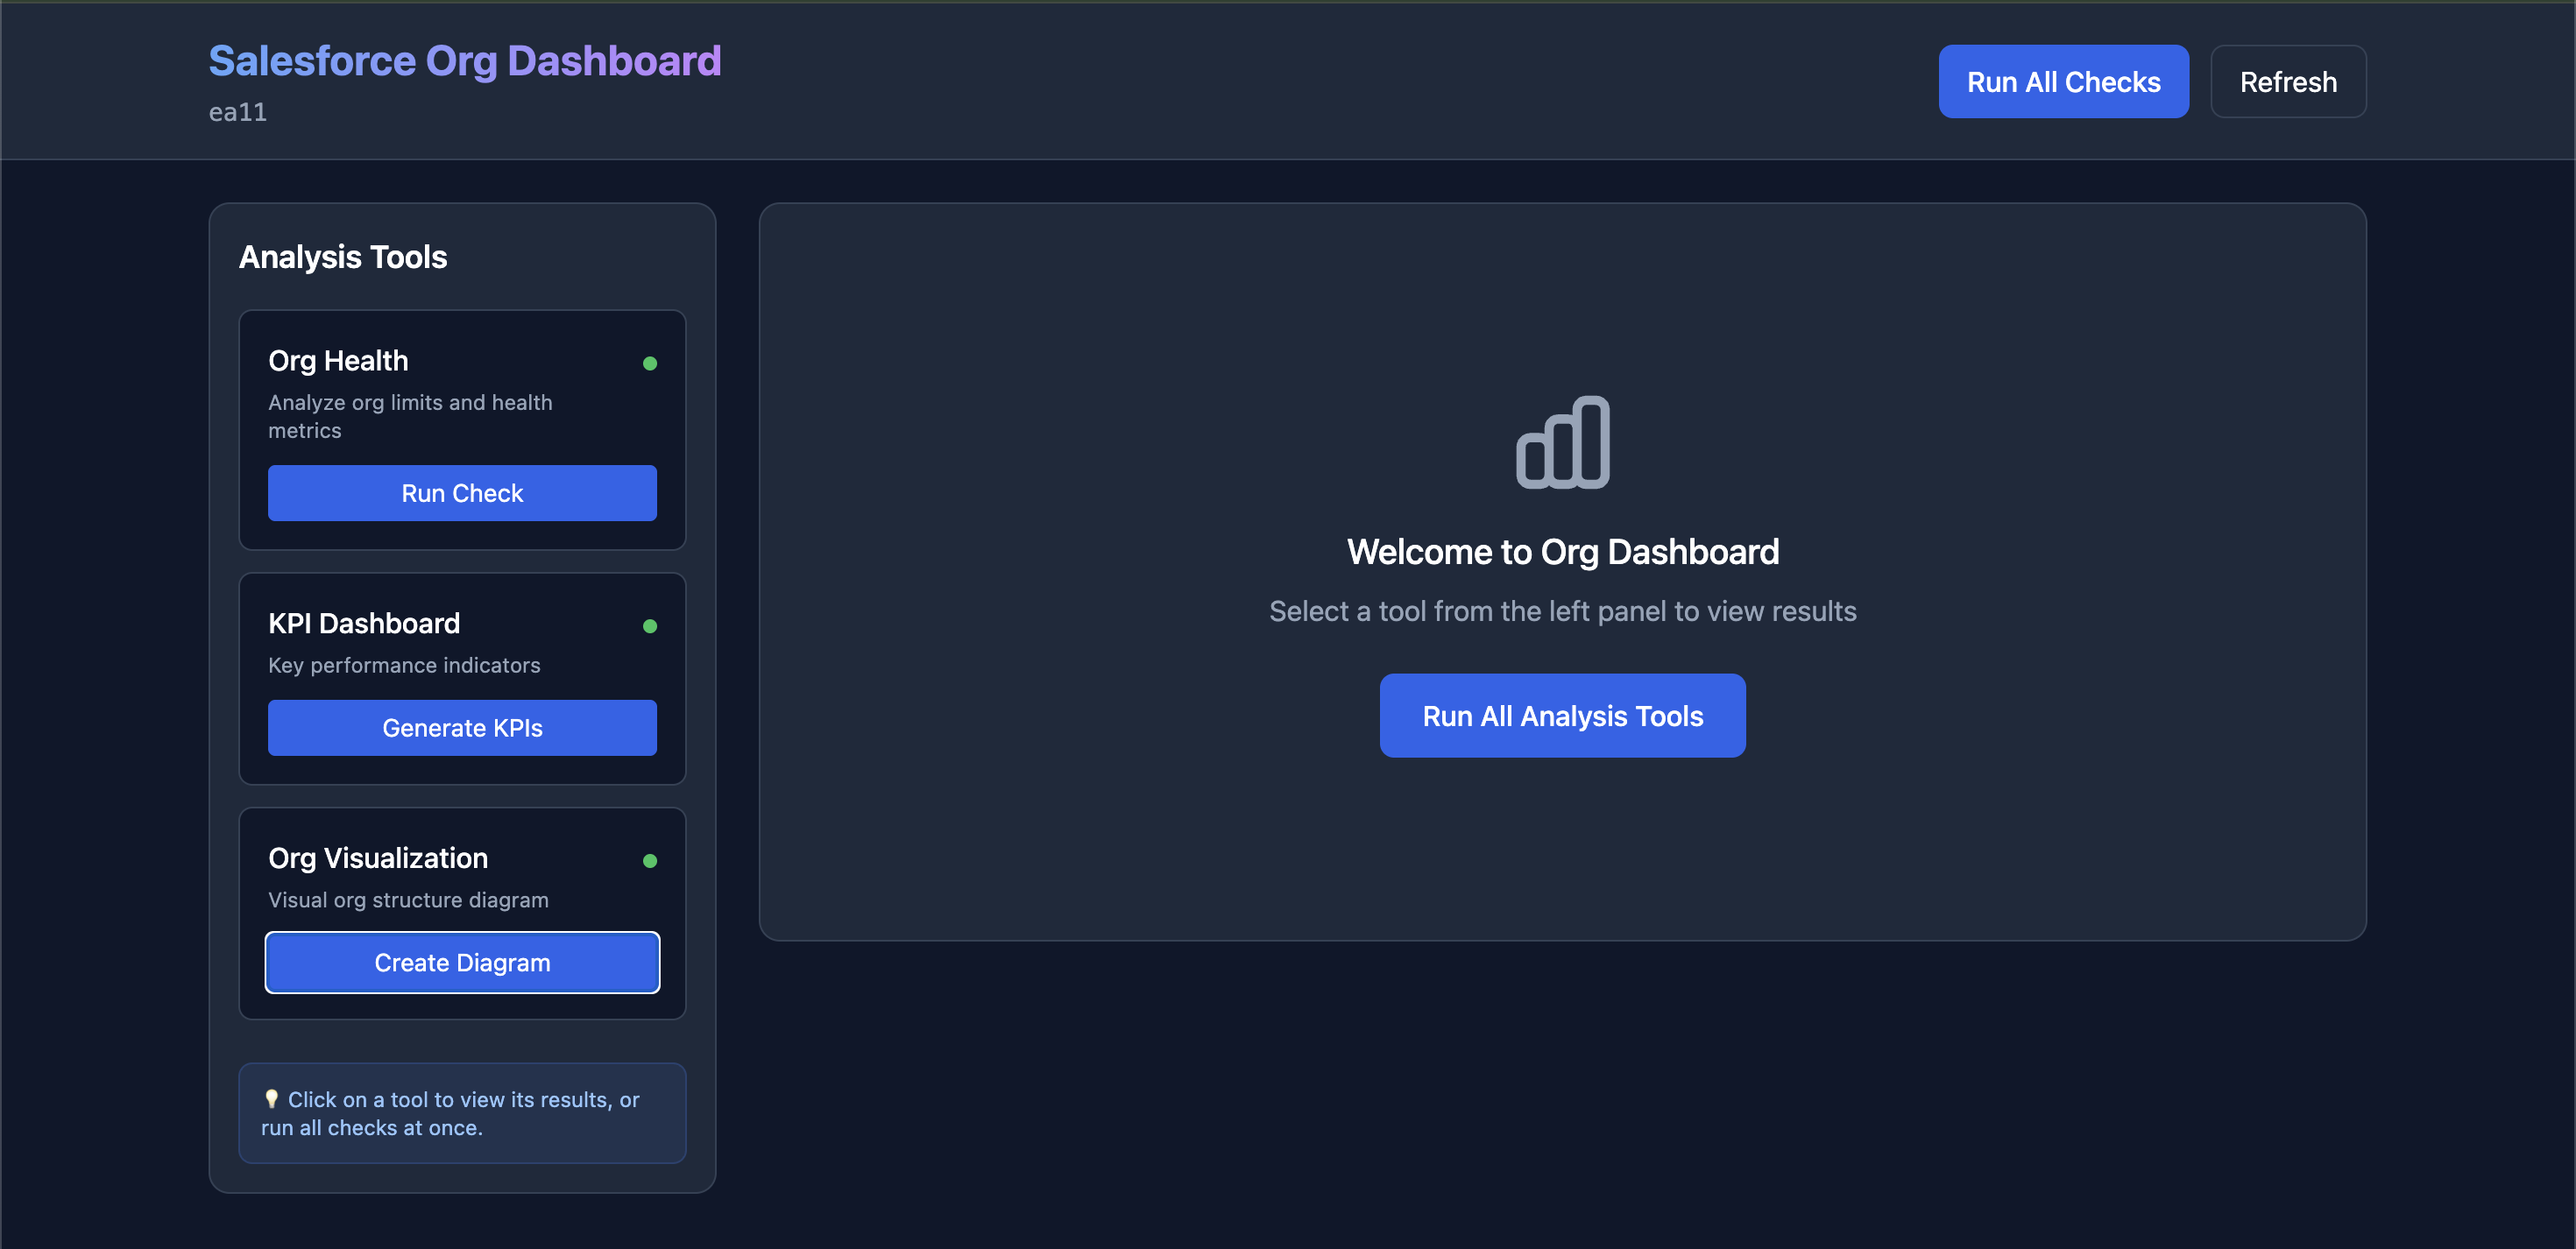
Screenshot
Installation
npm install -g sf-org-dashboardPrerequisites
Make sure you have the following tools available:
# Install the required Salesforce tools
npm install -g salesforce-org-health
npm install -g sf-kpi-dashboard

# Install Salesforce CLI plugin for org visualization
sf plugins install  sfdx-mohanc-plugins
Usage
Basic Usage
sf-dashboard -o [email protected]Custom Port
sf-dashboard -o [email protected] -p 3000Don't Auto-Open Browser
sf-dashboard -o [email protected] --no-openOptions
-o, --org <username>     Salesforce org username or alias (required)
-p, --port <port>        Port for local server (default: 8080)
--no-open                Do not automatically open browser
-h, --help               Display help for command
-V, --version            Output the version number
How It Works
- Start the Dashboard: Run the CLI command with your org username
- Select Tools: Click on any tool in the left panel to run it
- View Results: Results appear in the right panel
- Run All: Use "Run All Checks" to execute all tools at once
Tool Integrations
1. Salesforce Org Health (salesforce-org-health)
- Analyzes org limits, API usage, storage, and more
- Generates comprehensive health reports
2. KPI Dashboard (sf-kpi-dashboard)
- Displays key performance indicators
- Shows critical org metrics
3. Org Visualization (sf mohanc org viz)
- Creates visual diagrams of org structure
- Outputs SVG format for easy viewing
Dashboard Interface
Left Panel - Tools
- List of available analysis tools
- Status indicators (pending/running/completed/error)
- Individual run buttons for each tool
Right Panel - Results
- Displays output from selected tool
- Supports HTML, text, and SVG formats
- Scrollable content area
Example Output
╔════════════════════════════════════════════╗
║   Salesforce Org Dashboard Starting...   ║
╚════════════════════════════════════════════╝

Organization: [email protected]
Port: 8080

✓ Server running at http://localhost:8080

Press Ctrl+C to stop the server

Opening browser...
API Endpoints
GET /- Main dashboard HTMLGET /api/data- Get current dashboard data (JSON)POST /api/run/:tool- Run a specific tool (health/kpi/visualization)
Tips
- First Time Setup: Run each tool individually first to ensure they're properly configured
- Large Orgs: Analysis may take longer for orgs with lots of metadata
- Multiple Orgs: Start separate instances on different ports for different orgs
- Refresh: The dashboard auto-refreshes every 5 seconds, or click "Refresh" manually
Troubleshooting
Tool Not Found
If a tool isn't installed, install it globally:
npm install -g salesforce-org-health
npm install -g sf-kpi-dashboard
sf plugins install sfdx-mohanc-plugins``

### Port Already in Use
Use a different port:
```bash
sf-dashboard  -o [email protected] -p 9000
Authentication Issues
Make sure you're authenticated with the Salesforce CLI:
sf org login web -a myorgLicense
MIT (c) Mohan Chinnappan