
sheetsee-charts
v0.0.0
Published
enables chart creation functionality with sheetsee.js
Downloads
8

Readme
sheetsee-charts
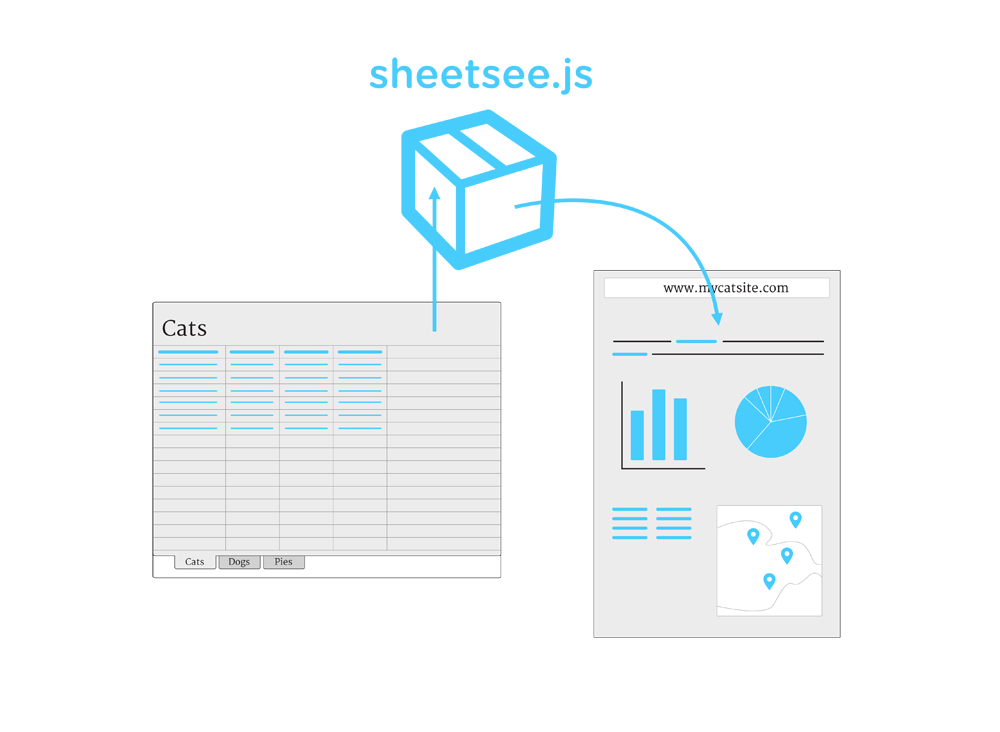
Module for working with charts with sheetsee.js. It provides three d3 chart options to use with your spreadsheet data. Below is a portion of the sheetsee.js documentation regarding charts, for the full sheetsee.js documentation, go here!
Make a Chart
Sheetsee.js comes with a d3.js bar, pie and line chart. Each requires your data be an array of objects, formatted to contain "label" and "units" keys. See the section above on Your Data to learn about formatting.
You'll have to experiement with the charts to find the correct size your <div> will need to be to hold the chart with your data in it nicely.
You can also make your own d3 chart in a separate .js file, link to that and pass your data on to it. I'd love to see people building some other charts that will work with Sheetsee.
Bar Chart
To create a bar chart you'll need to add a placeholder <div> in your HTML with an id.
<div id="barChart"></div>In your CSS, give it dimensions.
#barChart {height: 400px; max-width: 600px; background: #F8CDCD;}In a <script> tag set up your options.
var barOptions = {m: [60, 60, 30, 150], w: 600, h: 400, div: "#barChart", xaxis: "no. of pennies", hiColor: "#FF317D"}- m is margins: top, right, bottom, left
- w and h are width and height, this should match your CSS specs
- div is the id for the
<div>in your HTML - xaxis is optional text label for your x axis
- hiColor is the highlight color of your choosing!
Then call the d3BarChart() function with your data and options.
Sheetsee.d3BarChart(data, barOptions)Line Chart
To create a line chart you'll need to add a placeholder <div> in your html with an id.
<div id="lineChart"></div>In your CSS, give it dimensions.
#lineChart {height: 400px; max-width: 600px; background: #F8CDCD;}In a <script> tag set up your options.
var lineOptions = {m: [80, 100, 120, 100], w: 600, h: 400, div: "#lineChart", yaxis: "no. of pennies", hiColor: "#14ECC8"}- m is your margins: top, right, bottom, left
- w and h are width and height, this should match your CSS specs
- div is the id for the
<div>in your HTML - yaxis is optional text label for your y axis
- hiColor is the highlight color of your choosing!
Then call the d3LineChart() function with your data and options.
Sheetsee.d3LineChart(data, lineOptions)Pie Chart
To create a bar chart you'll need to add a placeholder <div> in your html with an id.
<div id="pieChart"></div>In your CSS, give it dimensions.
#pieChart {height: 400px; max-width: 600px; background: #F8CDCD;}In a <script> tag set up your options.
var pieOptions = {m: [80, 80, 80, 80], w: 600, h: 400, div: "#pieChart", hiColor: "#14ECC8"}- m is your margins: top, right, bottom, left
- w and h are width and height, this should match your CSS specs
- div is the id for the
<div>in your HTML - hiColor is the highlight color of your choosing!
Then call the d3PieChart() function with your data and options.
Sheetsee.d3PieChart(data, pieOptions)