
signalk-race-plan
v0.2.3
Published
Race planning for your active route: see which legs are beats, reaches and runs, target speed from your polar, time on each tack, and live ETAs at every mark and the finish

Maintainers
 ghotihook
Readme
Race Plan for Signal K
Know how the race will play out before the start, and where you stand while you sail it.
Race Plan turns the active route into a leg-by-leg plan from your wind and your boat's polar. For every leg you get whether it's a beat, reach or run, the target speed, the time on each tack or gybe, and the time you'll reach each mark and the finish. On the water it updates live from your instruments, measured from where the boat actually is.
Why use it
- Plan on the dock. Type in the forecast wind and see the whole course at once: which legs are beats, reaches or runs, which board each is mostly sailed on, and how long it should take. Good for sail choice and for the pre-start briefing.
- Know your laylines. On a beat, the port/stbd times show how much of each tack is left. When one side disappears, you're on the layline.
- Keep track of the clock. The ETA at every mark and at the finish is recalculated from the boat's position in the current wind, so you know when the next leg starts and whether you'll make a time limit or a tide gate.
- Crew can use their phones. It's a web page served by your Signal K server, so anyone aboard can open it in a phone browser with nothing to install. The key columns fit a phone screen.
- Works with what you already have. It uses the route you've activated in your chart app and the polar you already have in Signal K. The ‹ › mark buttons move the active mark for every connected app, not just this screen.
Reading the screen
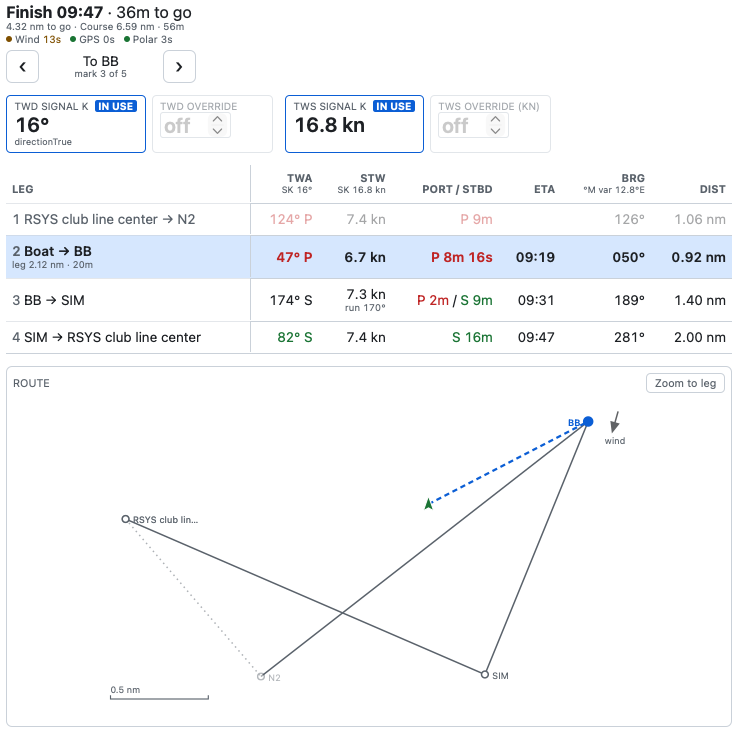
The screenshot shows a race in progress on live Signal K wind, with the boat on the second leg heading to BB. The first leg is already sailed. The highlighted row is 2 Boat → BB: 0.92 nm to go at 6.7 kn, all on port, arriving 09:19. From top to bottom:
- Finish 09:47 · 36m to go: the summary, with the remaining distance and the whole course below it.
- ● Wind 13s ● GPS 0s ● Polar 3s: the live strip. Position and polar data are fresh. The wind is amber because it last updated 13 seconds ago, close to the 15-second stale limit.
- ‹ To BB · mark 3 of 5 ›: the mark you're sailing to. Both buttons are active because this mark is in the middle of the route.
- TWD 16° / TWS 16.8 kn, tagged In use: the wind in use. Here it's live from Signal K, and the override boxes beside them are dimmed and empty.
- The table: one row per leg, with the time on each tack or gybe. Leg 1 is dimmed because it's sailed. The current leg is highlighted, with the full mark-to-mark leg (2.12 nm, 20m) underneath, and its time on port counts down in seconds. Leg 3 is almost dead downwind (TWA 174°), so it's sailed as a run at 170° with the time split between the two gybes:
P 2m / S 9m. - The map: the course from above. The sailed leg is dotted and N2 is faded. The boat is the green arrow, with a dashed blue line to BB.
Install
In the Signal K admin UI, open Appstore → Available, find Race Plan and install it. Restart the server, then open Webapps → Race Plan (/signalk-race-plan/). It's a plain webapp with nothing to enable or configure.
For development, install from a local checkout:
cd ~/.signalk
npm install /path/to/signalk-race-plan
Requirements
- Signal K server 2.x, for the v2 Course and Resources APIs.
- An active route, e.g. created and activated in Freeboard-SK.
- True wind data (see Wind), or overrides.
- Position (
navigation.position) for remaining distance, time and ETAs. - Magnetic variation (
navigation.magneticVariation) for magnetic bearings and the magnetic TWD fallback. Optional. - Start time (
navigation.racing.startTimefrom signalk-racer). Optional. - Write access to the Course API for the ‹ › mark buttons. On a secured server, log in to the Signal K admin UI in the same browser.
- For STW and port/stbd:
- signalk-polar-performance-plugin
- A polar made active through a polar resource provider such as signalk-polar-management
- Race Plan reads the curve for the TWS in use from
/plugins/signalk-polar-performance-plugin/polar/queries/curve. The performance factor is already applied.
The table
Columns are ordered by importance, so a phone shows Leg, TWA, STW and Port / Stbd without scrolling. The Leg column stays in place as you swipe right to see the rest.
| Column | What it shows |
|--------|---------------|
| Leg | Leg number and From → To, using waypoint names from the route. Falls back to WP1, WP2, … On the current leg it's Boat → To (see During the race) |
| TWA | TWD − true leg bearing. S means the wind is on the starboard side when sailing the leg, P port. It's coloured green (S) or red (P) when the leg can be sailed directly. On beat/run legs it isn't coloured, because both sides are sailed. Without a polar the app can't tell which legs are beats or runs, so every TWA is coloured |
| STW | Target boat speed from the polar. On a direct leg it's the speed at the leg's TWA. If the leg is tighter than the polar's beat angle, it's the upwind target with beat <angle> underneath; if it's deeper than the run angle, the downwind target with run <angle> underneath |
| Port / Stbd | Time on each tack or gybe, and so the leg time: the two add up to it. The leg takes distance ÷ speed made good along it — STW on a direct leg, target VMG ÷ |cos(TWA)| on a beat or run — and a direct leg puts all of that on one side. A beat/run leg is split by resolving it along and across the wind: dead upwind or downwind is 50/50, and the closer the mark is to the layline, the more time goes on one side. A side with under 1% of the leg is left out. Whole minutes, except on the leg from the boat when one board sails all of it: that one counts down in seconds (S 7m 14s) |
| ETA | Clock time at the mark (nearest minute), adding leg times from now. Blank for sailed legs. Needs a fresh position |
| BRG | Great-circle bearing to the mark, in degrees magnetic: what the compass shows. Converted from true using navigation.magneticVariation; the header shows the variation used, e.g. °M var 12.8°E. If no variation is available, the true bearing is shown and the header warns °T no variation |
| DIST | Great-circle distance to the mark, in nautical miles |
Sailed legs are dimmed and the current leg is highlighted. Under the TWA and STW headers is the wind in use: SK 133° for Signal K, or override 200° in amber.
The map
Under the table, the course from above, north up:
- Route: a line through the marks. Legs already sailed are dotted and faded.
- Marks: a circle each, with the waypoint name (long names are shortened). The mark being sailed to is filled and labelled in blue; marks behind you are faded.
- Line to the mark: a thick dashed blue line to the mark in use — from the boat when there's a position, otherwise from the mark behind it.
- Boat: a green arrow at
navigation.position, pointing atnavigation.headingTrue. With no heading it points at the mark. With no position less than 15 s old the boat is left off, and the map says so. - Wind arrow: top right, pointing the way the wind is blowing (away from the TWD in use). It follows the override when one is set.
- Scale bar: bottom left, in metres or nautical miles.
Zoom to leg / Whole route switches between fitting the whole course and fitting just the leg being sailed; the choice is kept in that browser. The box takes the shape of what it's showing, so a north–south course gets a tall map and an east–west one a wide, short map.
It's a sketch of the course, not a chart: no coastline, depths or hazards. Navigate with your chart app.
Wind: Signal K or override
The header has two pairs of boxes, one pair for TWD and one for TWS. Each pair shows both the live Signal K value and your override. The one in use is outlined and tagged In use; the other is dimmed.
| | Signal K value | Override |
|---|---|---|
| TWD (true) | The first of these that's arriving:1. environment.wind.directionTrue2. environment.wind.directionMagnetic + navigation.magneticVariation3. navigation.headingTrue + environment.wind.angleTrueWaterThe source in use is shown under the value | Degrees true, as in forecasts |
| TWS | environment.wind.speedTrue | Knots |
- Smoothing: live values are smoothed so the table doesn't jump with every gust or shift. After a gap, smoothing starts again from the first new reading, so old wind isn't blended in.
- Stale data: if a live value hasn't updated for 15 seconds, it's shown as e.g.
270° stale. It isn't used, and the columns that depend on it show--. - Overrides: type a value to plan with a forecast. The override box turns amber and is tagged In use. Press × to clear it and go back to Signal K.
- Saved per browser: overrides are kept in that browser across reloads. The amber box is the reminder that one is set.
The mark you're sailing to
The header shows it between two buttons — ‹ To WP1 · mark 1 of 5 › — and the table and map highlight the leg that ends there.
- › advances to the next mark, ‹ goes back one. Each button is greyed out at that end of the route.
- The buttons move
activeRoute.pointIndexthrough the Signal K Course API: the same value your chart app advances on arrival, so every client following the course sees the change, not just this browser. - The page moves straight away, then the server's answer is taken as the truth. If the server refuses — a secured server you aren't logged in to, say — the step is undone and the header shows
Could not change mark: …. - Race Plan equally follows changes made elsewhere, e.g. Freeboard-SK's arrival circle or "next point", and switches when a different route is activated or reversed.
During the race
With a position from navigation.position less than 15 s old:
- Current leg: the row is worked out from the boat to the mark (
Boat → WP1). Bearing, distance, TWA, STW and port/stbd are all what's left to sail from where you are. The full mark-to-mark leg is shown underneath in small text. - Laylines: on a beat, port/stbd shows how much of each tack is left. When one side disappears (e.g. just
S 5m), you're on that layline. If you overstand, the TWA to the mark widens past the beat angle and the leg becomes a direct reach. - ETA and finish: each mark's ETA adds the leg times from now. The summary shows the finish time, distance and time to go, plus the whole course distance and time.
- Before the start: while heading to the first point of the route, an extra
Boat → <first mark>row is added. If signalk-racer publishesnavigation.racing.startTime, the ETAs assume you don't leave the start before the gun.
No position, or position older than 15 s:
- All legs show mark to mark.
- ETAs show
--, and the header saysNo position: remaining and ETA unavailable. - The course total is still shown, which is what you want when planning ashore.
Missing leg times: if any leg's time is unknown (no wind, no polar), the ETA at that mark and every later mark shows --, as does the finish time.
Is the data live?
Numbers can sit still for a while even when data is flowing, so the header has a live strip: ● Wind 1s ● GPS 0s ● Polar 6s.
- Dot: pulses each time new data for that input arrives.
- Age: seconds since the last update. Green is under 5 s and amber is 5–15 s. After 15 s it's red stale, and values from that input are no longer used.
- Wind is the older of TWD and TWS, counting only values from Signal K. If both are overridden, it shows amber override.
- Polar is the time since the curve was last read. It's re-read every 15 s, and shows red error if reading fails.
- Time to the mark on the leg from the boat is shown to the second when one board sails the whole leg (
S 7m 14s), so it visibly ticks down as you sail. Everything else is in whole minutes.
A worked example
Wind from 000°T at 12 kn, magnetic variation 12.3°E, with a polar whose best upwind angle is 40° (6.0 kn) and best downwind angle is 150° (7.0 kn). At 14:00 the boat has rounded Windward and is 0.4 nm down the 1 nm reach to Wing.
Header summary: Finish 14:49 · 49m to go (5.10 nm to go · Course 7.00 nm · 1h 12m)
| Leg | TWA | STW | Port / Stbd | ETA | BRG °M | DIST | |-----|----:|----:|------------:|----:|-------:|-----:| | 1 Start → Windward | 0° S | 6.0 knbeat 40° | P 10m / S 10m | | 348° | 1.50 nm | | 2 Boat → Wingleg 1.00 nm · 8m | 120° P | 7.8 kn | P 4m 39s | 14:05 | 108° | 0.60 nm | | 3 Wing → Leeward | 120° S | 7.8 kn | S 8m | 14:12 | 228° | 1.00 nm | | 4 Leeward → Windward | 30° S | 6.0 knbeat 40° | P 3m / S 14m | 14:29 | 318° | 1.50 nm | | 5 Windward → Finish | 180° S | 7.0 knrun 150° | P 10m / S 10m | 14:49 | 168° | 2.00 nm |
- Leg 1 is dead upwind. It's sailed as a beat at 40° on each tack, so its 20m is split evenly between them. On the page it's dimmed, because it's already sailed.
- Leg 2 is the current leg (bold here, highlighted on the page), so it runs from the boat to Wing: 0.60 nm to go, all of it on port, counting down in seconds. The full mark-to-mark leg is shown underneath for reference.
- Legs 2 and 3 are reaches, sailed directly on one tack at the polar speed for 120°.
- Leg 4 is 30° off the wind with the wind on starboard. It's still a beat, but mostly on starboard tack, with a short port hitch.
- Leg 5 is dead downwind. It's sailed as a run at 150° on each gybe, again split evenly.
- ETAs add up from now: 14:00 + 4m 39s at Wing (14:05), + 7m 45s at Leeward (14:12), and so on to the finish.
Status messages
| Message | Meaning |
|---------|---------|
| No active route | No route is active in the Course API |
| No position: remaining and ETA unavailable | No navigation.position in the last 15 s. Legs are shown mark to mark |
| Course API unavailable: … | The Course API request failed |
| Could not change mark: … | The ‹ › buttons couldn't move activeRoute.pointIndex. Unauthorised means the server needs you to log in |
| °T no variation (under BRG) | Nothing publishes navigation.magneticVariation, so bearings are shown true, not magnetic |
| Disconnected, retrying… | The data connection to the server dropped. It reconnects every 3 s |
| Polar: No active polar selected | The polar plugin is running but no polar is active |
| Polar plugin not reachable (…) | The polar plugin isn't installed or running, or you aren't logged in on a secured server |
| Polar plugin not responding (…) | The polar plugin didn't reply within 5 s |
While any polar message is showing, STW and port/stbd show --, and Race Plan retries every 5 s. It never keeps showing speeds from an earlier polar: the curve is re-read every 15 s, and a failed read clears it straight away.
Limitations
- Polar only: figures don't include current, leeway, tacking or gybing losses, or wind shifts along a leg.
- Fewest boards: the port/stbd split assumes one tack or gybe each way, not how often you'd actually tack.
- Straight line from the boat: the current leg is measured straight from the boat to the mark, ignoring obstructions.
- Same wind for every leg: ETAs for later legs assume the current wind holds for the rest of the race.
- Variation: magnetic bearings use the boat's current variation for every leg, which is fine for a race course but not for a long passage. Compass deviation isn't applied.
- Route edits: if you move or add marks in the active route, reload the page to see them. Race Plan only refetches the route when a different route is activated or the direction is reversed.
- The map is not a chart: it shows only the route and the boat, with no land, depths or hazards, and no zoom or pan beyond the two fits.