
simple-pie
v1.3.8
Published
Super light weight and super simple svg pie diagram
Maintainers
 serjilyashenko
Readme


This project creates simple svg pie and doughnut charts for infographics like graphs and others.
If you are going to use simple diagram in react project, please check react-simple-pie out.
simple-pieandreact-simple-piepackages are parts of the simple-pie-project monorepo.
Motivation
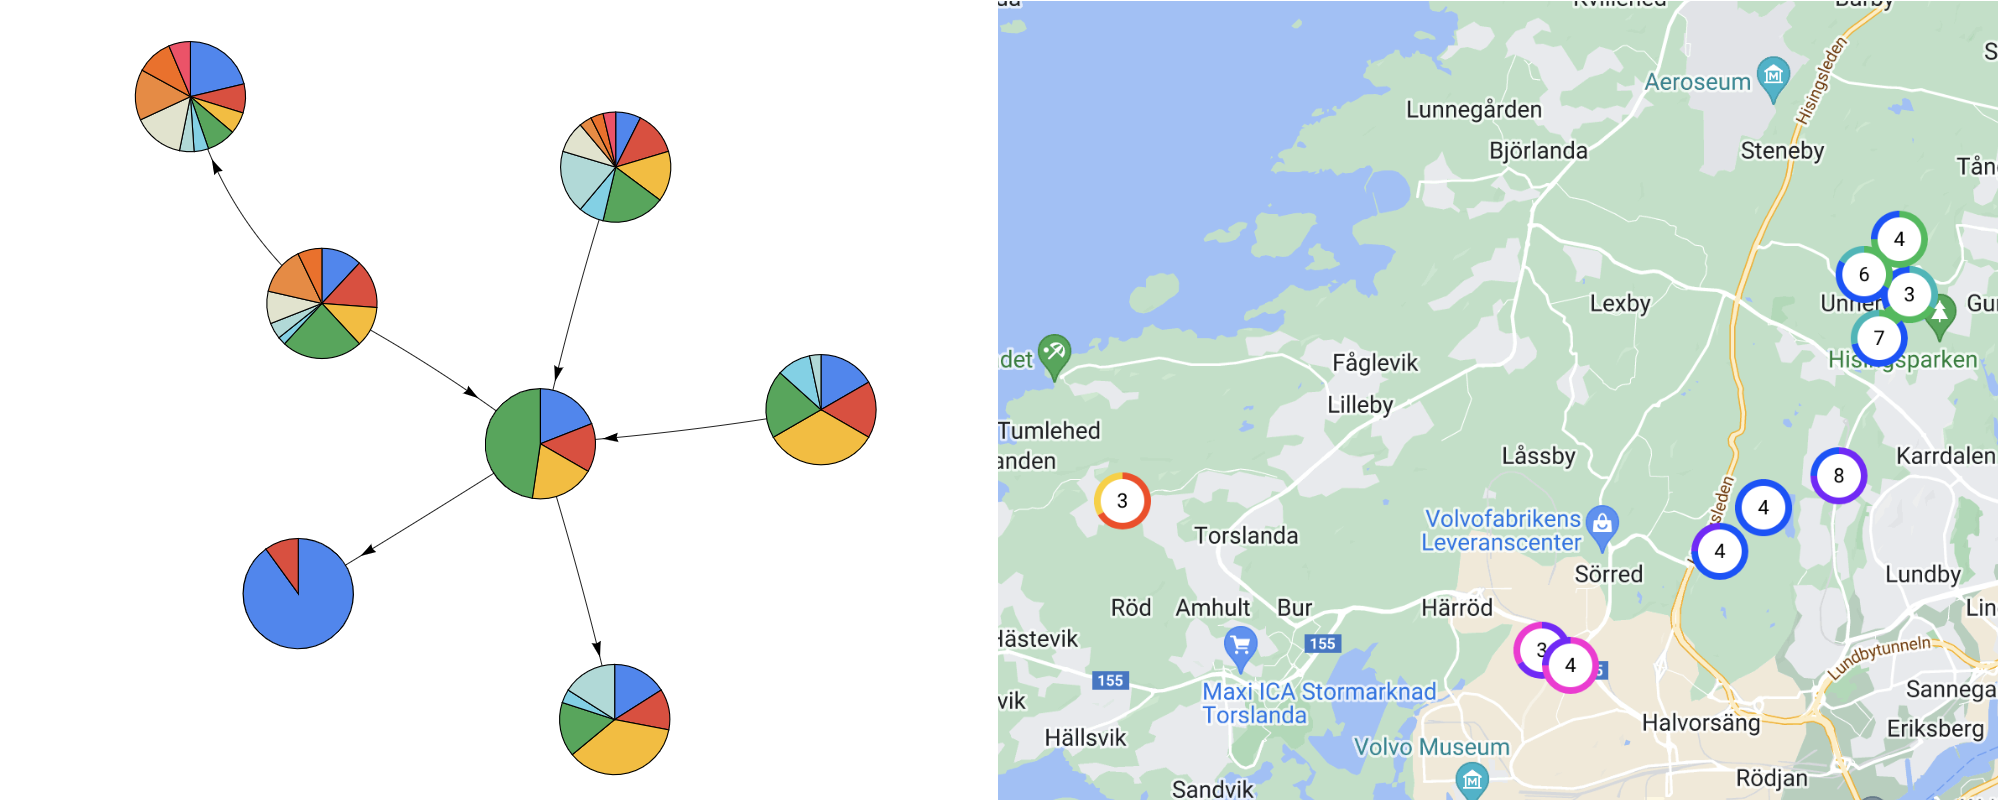
Some time ago I had to integrate a network graph. And the every node of the network graph would be tiny pie chart. The network graph library doesn't support anything else except png or svg as node inner content. So, it is not very nice idea to keep a bunch of png or svg files for every case of data distribution. And for obvious reasons it is not possible to use HighCharts, Chart.js or other data visualization library. (Perhaps it would work with d3, but I'm not sure, it is an overkill to keep such big library for the such small purpose)
Well the simple-pie does exactly this thing. It generates tiny svg pie which can be integrated into network graph or
map or any other case, when you can't use data-visualization libraries.
Installation
npm install simple-pie --save

or

yarn add simple-pie
Use
Client (Frontend) Bundle:
import {simplePie, simpleDoughnut} from "simple-pie";

const svgPie = simplePie([2, 1, 1, 2]);
const svgDoughnut = simpleDoughnut([2, 1, 1, 2]);

document.body.appendChild(svgPie);
document.body.appendChild(svgDoughnut);
As data-uri image:
import {simplePie} from "simple-pie";

const element = simplePie([2, 1, 1, 2]);
element.setAttribute("width", "70");
element.setAttribute("height", "70");

const svg = new XMLSerializer().serializeToString(element);
const dataUri = `data:image/svg+xml;base64,${btoa(svg)}`;

// Example for vis-network diagram
const nodes = new DataSet([{
  id: 1,
  shape: "image",
  image: dataUri,
  shapeProperties: { useImageSize: true },
},
...
HTML page:
Download
simple-pie.min.jsfile here
<div id="pie-container"></div>
<div id="doughnut-container"></div>

<script src="simple-pie.min.js"></script>
<script>
    const svgPieElement = simplePie([2, 1, 1, 2]);
    document.getElementById('pie-container').appendChild(svgPieElement);

    const svgDoughnutElement = simpleDoughnut([2, 1, 1, 2]);
    document.getElementById('doughnut-container').appendChild(svgDoughnutElement);
</script>
⚠️ The svg
heightandwidthare100%, so it trys to extend itself to available space. Thus, you should have wrapper with dimensions for your simple-pie diagram.
Interface
// Pie
type TPieOptions = {
  pallet?: string[];
  borderColor?: string;
  borderWidth?: number;
};

function simplePie(
  values: number[],
  options?: TPieOptions
): SVGElement;

// Doughnut
type TDoughnutOptions = TPieOptions & {
  inner?: number;                         // 0..1 - percent from outer radius
};

function simpleDoughnut(
  values: number[],
  options: TDoughnutOptions = {}
): SVGElement
If you need borderless diagram, just set borderColor: "transparent" or borderWidth: 0
❌ Old version interface
The old version of pie diagram is still supported. However, it is deprecated. Please use the new one.
export function simplePie(
  values: number[],
  pallet?: string[],
  borderColor?: string,
  borderWidth?: number
): SVGElement;
simpleDoughnut has only new version of the interface