
storycurve
v1.0.1
Published
Visualization method for comparing two temporal orders with additional metadata
Maintainers
 namwkim85
Readme
Story Curve
- A technique for visualizing nonlinear narratives
- Demo: http://storycurve.namwkim.org/
- If you have any quesiton, please feel free to contact: Nam Wook Kim, [email protected]
Story Explorer
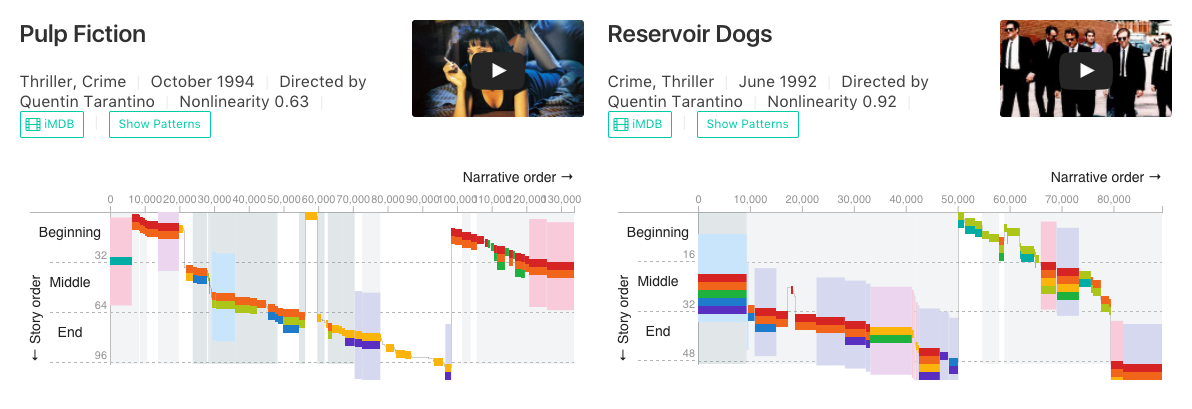
Story explorer is a system built using story curves to visually explore narrative structures of popular nonlinear films like Memento and Pulp Fiction. Try it.
Install
Dependencies
Include
storycurve.cssandstorycurve.jsin thedistfolder
<link rel="stylesheet" type="text/css" href="https://raw.githubusercontent.com/namwkim/storycurve/master/dist/storycurve.css">
<script src="https://raw.githubusercontent.com/namwkim/storycurve/master/dist/storycurve.js"></script>- Or, install using
npm
npm install storycurve --saveData
A story curve is designed to visualize any data that involves comparison of two orders for the same set of elelemts (e.g., story order vs narrative order of same events). An example of movie data we use in the demo is below:
{
 "movie_info": {
 ...
 },
 "script_info":{
   "scenes":[
     {
       "narrative_order":0,
       "story_order": 29,
       "scene_metadata":{
         "size":6288,
         "location": "Coffee Shop",
         "time":"Morning",
         ...
       },
       "characters":[
         "Young Man",
         "Young Woman",
         ...
       ]
       ...
     }
   ]
 }
}
You can take a look at the Pulp Fiction data using online json viewer.
Using Custom Data Format
You can use accessor functions in order to use your own custom data format. For example, if you have a dataset like the following,
[
 {
   x:0,
   y:29,
   size:6288,
   metadata1:"Coffee Shop",
   metadata2:"Morning",
   children:[
     "Young Man",
     "Young Woman"
   ]
 }
 ...
]
and using accessors as below, the story curve will be able to find appropriate data attributes to visualize.
 var vis = new storycurve('#pulp_fiction');
 vis.x(d=>d.x)
   .y(d=>d.y)
   .size(d=>d.size)
   .band(d=>d.metadata1)
   .backdrop(d=>d.metadata2)
   .children(d=>d.children);
How to Use
Here, we will demonstrate how we used the Pulp Fiction data to create its story curve. You can find more example codes that were used in the demo: here.
<div id="pulp_fiction" class="storycurve"></div>fetch('datasets/pulp_fiction_simple.json').then(function(response){
response.json().then(function(data){
var vis = new storycurve('#pulp_fiction');
// ranking and extracting top elements
var characters = rankCharacterByVerbosity(data.script_info, 8);
var locations = rankMetadataBySceneSize(data.script_info, 'location', 4);
var times = rankMetadataBySceneSize(data.script_info, 'time', 2);
// set domain for color scale, otherwise story curve will display all not just top ones.
vis.bandColorScale().domain(locations);
vis.backdropColorScale().domain(times);
vis.childColorScale().domain(characters);
// use a custom format and setting display options
vis.tooltipFormat(tooltipFormat.bind(vis))
.showBackdrop(true)
.showBand(true)
.showChildren(true)
.zoomEnabled(false)
.draw(data.script_info.scenes);
}
}The output of the code is the figure below. You can find the definitions of the functions (e.g., rankCharacterByVerbosity) used in the code above at the bottom of this file.

API Reference
# vis.x([accessor])
Sets an accessor function for the horizontal position of a data point. If no accessor is provided, returns the current accessor. The default accessor is as below:
vis.x(d=>d.narrative_order);# vis.y([accessor])
Sets an accessor function for the vertical position of a data point. If no accessor is provided, returns the current accessor. The default accessor is as below:
vis.x(d=>d.story_order);# vis.size([accessor])
Sets an accessor function for the size of a data point. If no accessor is provided, returns the current accessor. The default accessor is as below:
vis.size(d=>d.scene_metadata.size);# vis.children([accessor])
Sets an accessor function for children of a data point. Child elements are vertically stacked with different colors. If no accessor is provided, returns the current accessor. The default accessor is as below:
vis.children(d=>d.characters);# vis.child([accessor])
Sets an accessor function for a child in the children list. That is, if the child object contains multiple attributes, it needs to be specified what attribute is used as a label for the child. If no accessor is provided, returns the current accessor. The default accessor is as below:
vis.child(child=>child);# vis.band([accessor])
Sets an accessor function for a metadata for a data point which is visualized as a surrounding band. If the categories of the metadata are too many, it is desirable to filter them in advance as they can overload the visualization. If no accessor is provided, returns the current accessor. The default accessor is as below:
vis.band(d=>d.scene_metadata.location);# vis.backdrop([accessor])
Sets an accessor function for a metadata for a data point which is visualized as a backdrop. If the categories of the metadata are too many, it is desirable to filter them in advance as they can overload the visualization. If no accessor is provided, returns the current accessor. The default accessor is as below:
vis.band(d=>d.scene_metadata.time);# vis.showBand([boolean])
Determins whether to show bands or not. If a boolean is not specified, returns the current setting. The default is false:
vis.showBand(false);# vis.showBackdrop([boolean])
Determins whether to show backdrops or not. If a boolean is not specified, returns the current setting. The default is false:
vis.showBackdrop(false);# vis.showChildren([boolean])
Determins whether to show children or not. If not true, shows a single visual mark per column. If a boolean is not specified, returns the current setting. The default is false:
vis.showChildren(false);# vis.zoomEnabled([boolean])
Sets whether to enable zooming and panning. If a boolean is not specified, returns the current setting. The default is true:
vis.zoomEnabled(true);# vis.yaxisTitle([string])
Sets y-axis title. If a string is not specified, returns the current title. The default is '← Story order'':
vis.yaxisTitle('← Story order');# vis.xaxisTitle([string])
Sets x-axis title. If a string is not specified, returns the current title. The default is 'Narrative order →'':
vis.xaxisTitle('Narrative order →');# vis.tooltipFormat([format])
Sets the format of the tooptip. A data point corresponding to the mouse location is supplied to the callback. The default is just printing x and y orders:
vis.tooltipFormat(d=>{
let content = '<table>';
content += ('<tr><td><span style="color:#FBBD08">(X,Y)</span></td><td> ' + d.xo + ', ' + d.yo + '</td></tr>');
content += '</table>';
return content;
});The tooltip formatting function used in the demo is below:
function tooltipFormat(d){
  var childColor = this.childColorScale();

  var scene = d.orgData;

  var content = '<p>';
  content += '<strong style="color:#757575">N, S = ' + d.xo + ', ' + d.yo + '</strong><br>';

  scene.characters.map(function(c){
    content += ('<strong style="color:'+ childColor(c)+'">'+c+'</strong><br>');
  });
  var loc = scene.scene_metadata.location;
  if (loc){
    content += ('<strong style="color:#9E9E9E">'+loc+'</strong><br>');
  }

  var time = scene.scene_metadata.time;
  if (time){
    content += ('<strong style="color:#9E9E9E">'+time+'</strong><br>');
  }
  content += '</p>';

  return content;
# vis.bandColorScale([categorical_scale])
Sets and gets the color scale for band categorical metadata. It is a categorical color scale. The default palette is ['#eedaf1','#fad1df','#cfe8fc','#daddf1'], which means you need to set the domain for the 4 colors if showBand is set true. You need to filter data beforehand by setting unused categories to null (e.g., setting all but top 4 to null). Otherwise, unknown category is assigned no color (transparent).
var locations = rankMetadataBySceneSize(data.script_info, 'location', 4); //get top 4 locations
vis.backdropColorScale.domain(locations);
If you want to support more than 4 cateogories, you change the range of the scale:
var locations = rankMetadataBySceneSize(data.script_info, 'location', 5); //get top 5 locations
vis.backdropColorScale.domain(locations);
vis.backdropColorScale().range(['#d7191c', '#fdae61', '#ffffbf', '#abd9e9', '#2c7bb6']);
# vis.backdropColorScale([categorical_scale])
Sets and gets the color scale for backdrop categorical metadata. It is a categorical color scale. The default palette is ['#CFD8DC', '#90A4AE', '#607D8B'], which means you need to set the domain for the 8 colors if showBackdrop is set true. You need to filter data beforehand by setting unused categories to null (e.g., setting all but top 3 to null). Otherwise, unknown category is assigned no color (transparent). You can modify the scale as you want by changing the domain and range of the scale similar to bandColorScale.
# vis.childColorScale([categorical_scale])
Similar to other color scales, it allows you to modify the color scale of children. The default is ['#db2828','#f2711c','#fbbd08','#b5cc18','#21ba45','#00b5ad','#2185d0','#6435c9'] which means you need to set the domain for the 8 colors if showChildren is set true. You need to filter data beforehand by setting them to null (e.g., setting all but top 8 to null). Otherwise, unknown category is assigned '#9E9E9E'. You can modify the scale as you want by changing the domain and range of the scale similar to bandColorScale.
# vis.highlights([highlights])
Immediately highlights the elements specified. It is used with isHighlighted, which checks if a data point needs to be highlighted. This is used in Story Explorer, when a user selectively highlights characters or locations, etc. An example of the input can be as below:
vis.highlights([
  {
    type:'child',
    filter:'Jules'

  },
  {
    type: 'band',
    filter: 'Morning'
   }
])
This filters a child named 'Jules' and a band named 'Morning'. You need to set an appropriate function for isHighlighted as well.
# vis.isHighlighted([checker])
It is used in conjuntion with highlights. checker receives three arguments target, d, highlights:
let highlightAll = function(target, d, highlights){
  return target.data==null?false:(highlights.length==0? true:
    highlights.some(h=>target.data==h.filter));
}
The above function highlights all visual marks that match highlights. checker is called for each child, band, and backdrop. target contains type to indicate the caller, i.e., 'child', 'band' or 'backdrop'. It also contains data that contains a corresponding value, e.g., 'Jules'. highlights is the input you specify in highlights.
For your information, the definition of highlights is below:
highlights(_) {
  if (!arguments.length) return this._highlights;
  this._highlights = _;

  //highlight marks
  this.container.selectAll('.scene-group')
    .select('.band')
    .style('fill-opacity',
      d => this._isHighlighted({
          type: 'band',
          data: this._band(d.orgData)
        },
        d.orgData, this._highlights) ? 1.0 : 0.0);

  this.container.selectAll('.scene-group')
    .select('.backdrop')
    .style('fill-opacity',
      d => this._isHighlighted({
          type: 'backdrop',
          data: this._backdrop(d.orgData)
        },
        d.orgData, this._highlights) ? 0.25 : 0.0);

  this.container.selectAll('.scene-group')
    .select('.children')
    .selectAll('.mark')
    .style('fill-opacity',
      d => this._isHighlighted({
          type: 'child',
          data: d.orgData
        },
        d.parentOrgDdata, this._highlights) ? 1.0 : 0.05);

  return this;
}
This function will immediately highlight highlights, meaning that draw does not need to be called.
You can use the following function to highlight co-occurrence.
let highlightCooccur = function(target, d, highlights){
  return target.data==null?false:(highlights.length==0? true:
    highlights.every(h=>
      h.type=='characters'?d[h.type].includes(h.filter):
        d.scene_metadata[h.type]==h.filter));
};
For a use case, please refer to the code of Story Explorer (link).
# vis.width([accessor])
Sets or gets the width of the visualization. When a new width is set, draw needs to be called again.
# vis.height([accessor])
Sets or gets the height of the visualization. When a new height is set, draw needs to be called again.
# vis.draw([data])
Draw or update a story curve with data. If any settings are updated, this function needs to be called with the same data.
# vis.on([name, listener])
Sets or gets a listner for events occurring on the story curve. Supported events include 'zoom', 'mouseover', 'mouseout', 'click' (i.e., name argument). listener for 'mouseover', 'mouseout', and 'click' events takes data, index, nodes as arguments, while 'zoom' receives transform so that you can coordinate with other visualizations.
let onZoom = function(transform){
  othervis.forEach(vis=>vis.transform('transform', transform));
};
vis.on('zoom', onZoom);
# vis.transform([op, param])
Reveals transform functions in d3-zoom. op can be any method of d3.zoom() such as 'scaleBy' or 'translateBy' and param is the parameters of the operator. For example, if you want to manually scale a story curve with a zoom factor 1.2:
vis.transform('scaleBy', 1.2);