
testreportium
v0.2.1
Published
Appium test reporter: smart, self-contained HTML test reports for Appium with Jest, WebdriverIO or any JUnit XML. One file, zero network calls, failure screenshots and recordings embedded, run history, flaky tests and quality gates.

Maintainers
 foyezkabir
Readme
testreportium
Smart, self-contained HTML test reports for Appium scripts. One file, zero network calls, zero runtime dependencies. Failure screenshots are embedded as base64, so the report can be attached to a ticket, emailed, or opened offline and still render exactly as it did on the machine that produced it.
Works with any test runner. WebdriverIO, Mocha, Jest, pytest and most others can write JUnit XML, and testreportium reads that. Jest also has a native reporter adapter.
npm install --save-dev testreportiumNeeds Node 18.3 or newer.
Screenshots
From this repo's demo data (npm run demo) with a simulated run history.
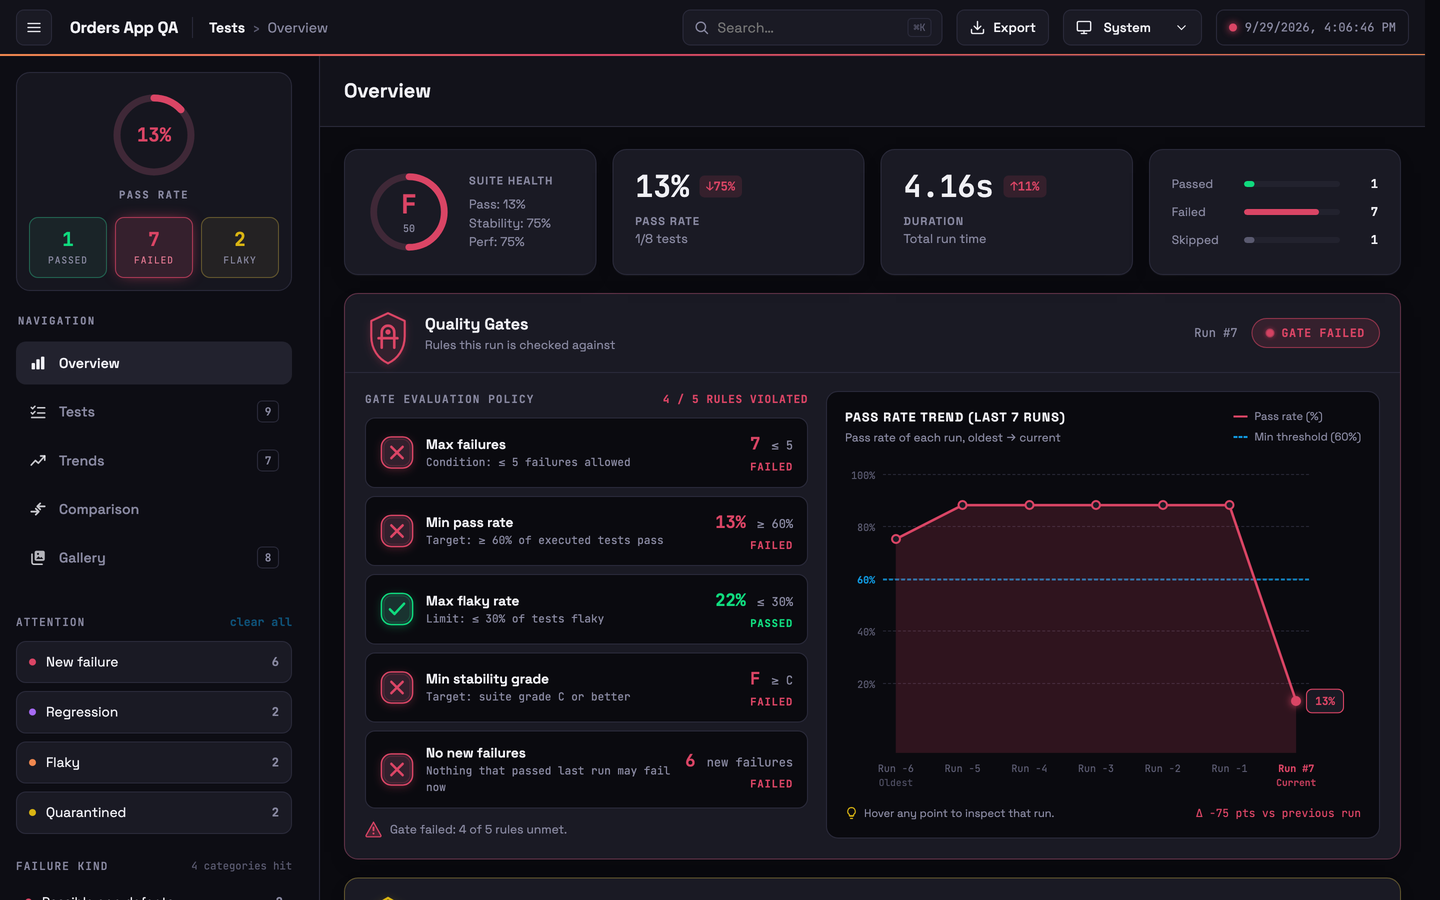
1. Overview
Suite health, pass rate and duration vs the last run, and the Quality Gates panel.
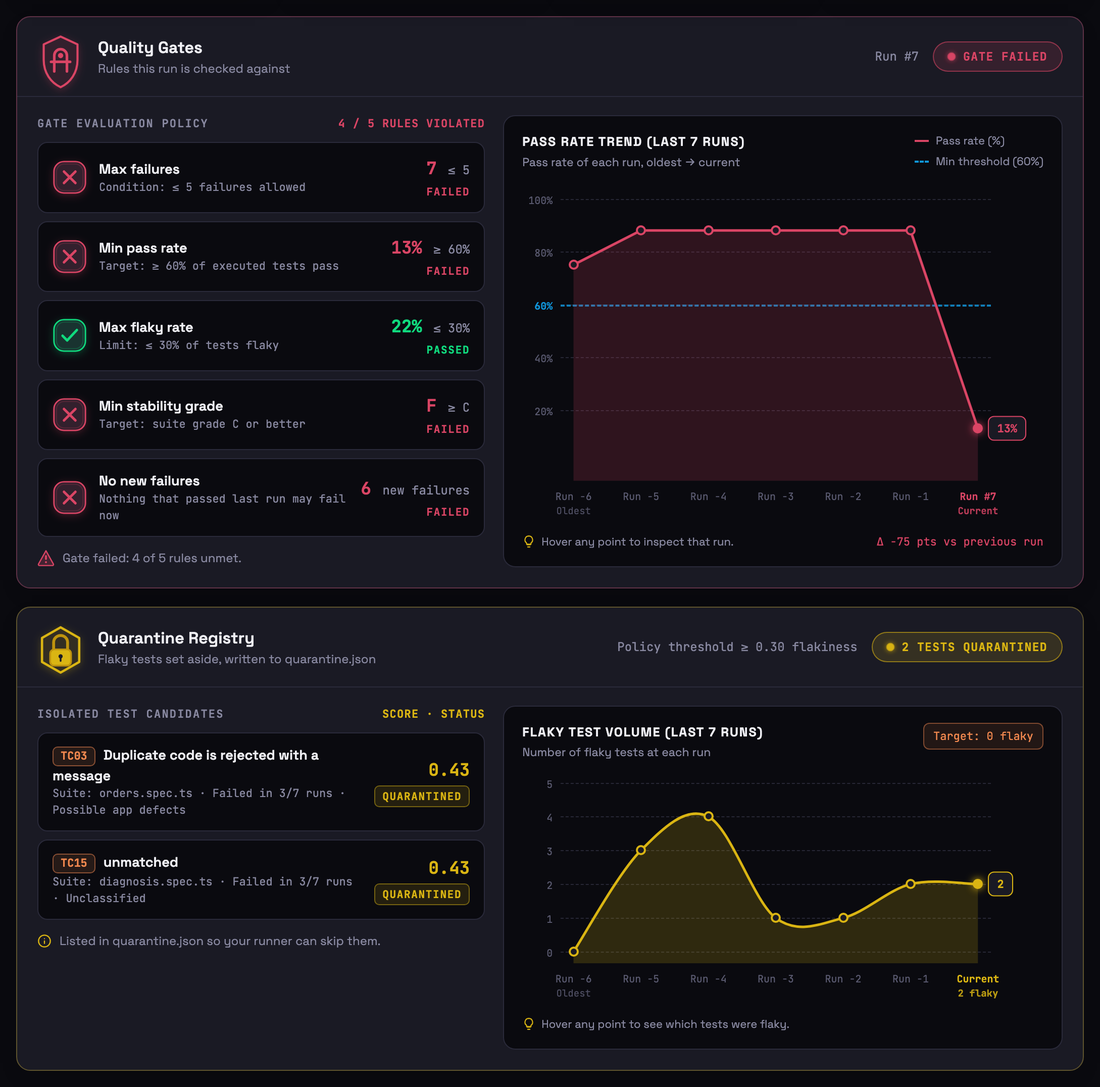
2. Quality Gates and Quarantine Registry
Every rule with its limit, and the flakiest tests. Hover any point on the charts for that run.
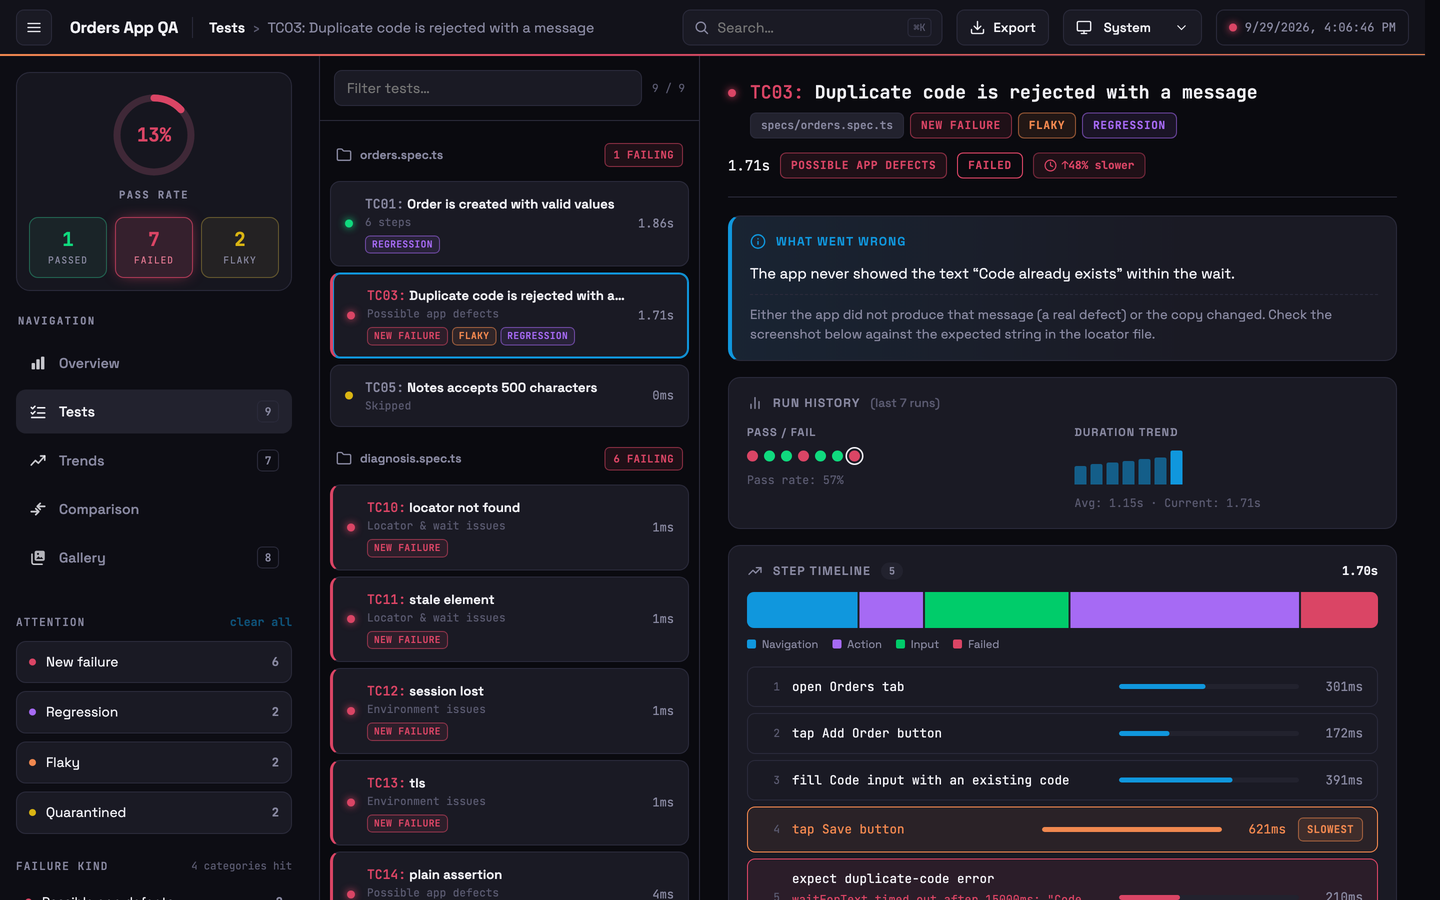
3. Test detail
Diagnosis, run history, step timeline, stack trace and the device screenshot at failure.
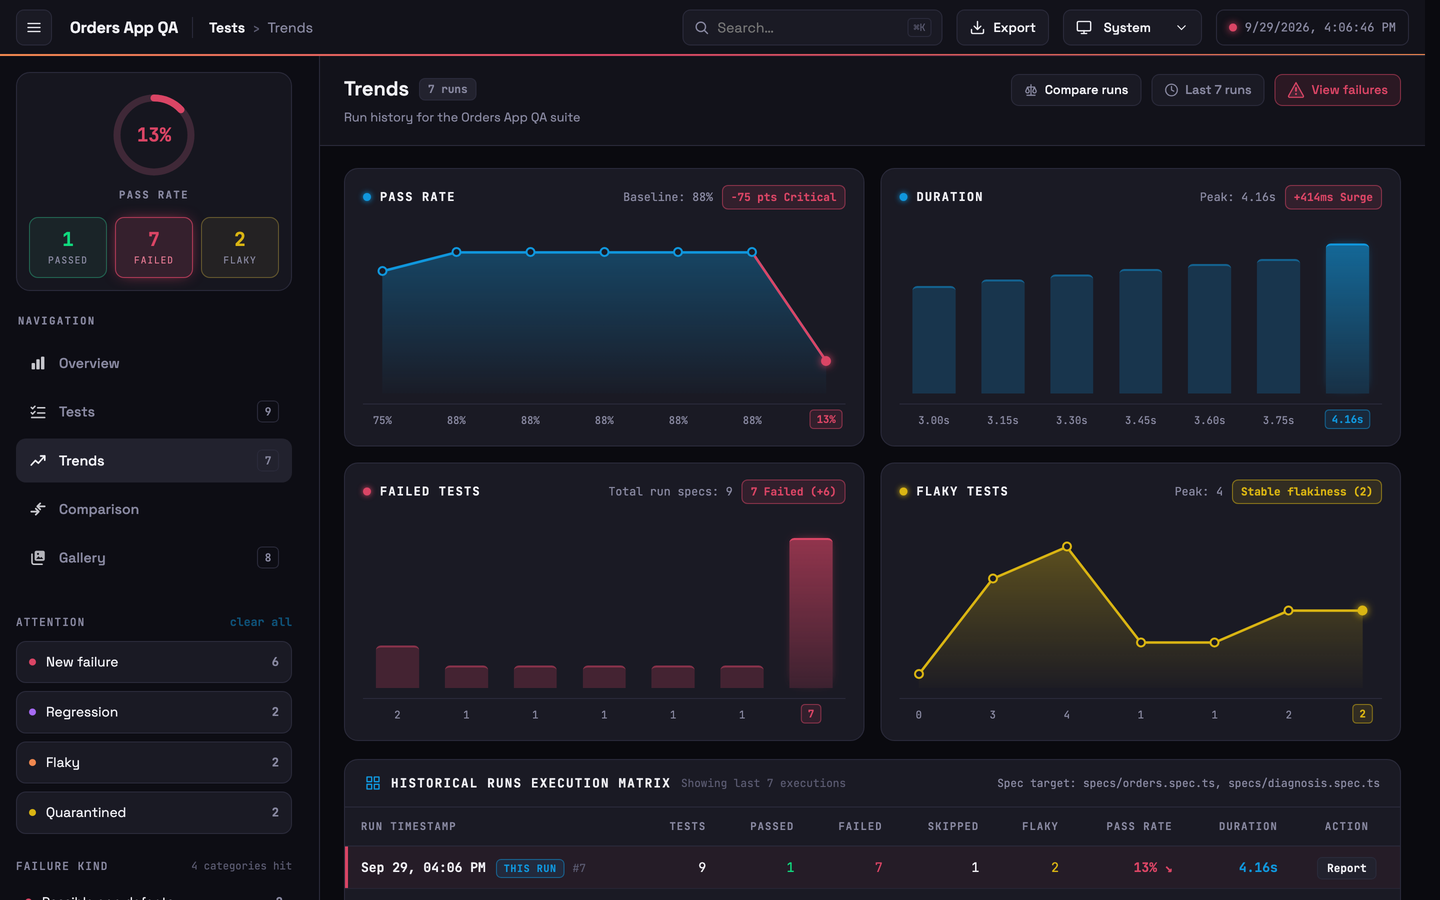
4. Trends
Pass rate, duration, failed and flaky tests across runs, and the run table.
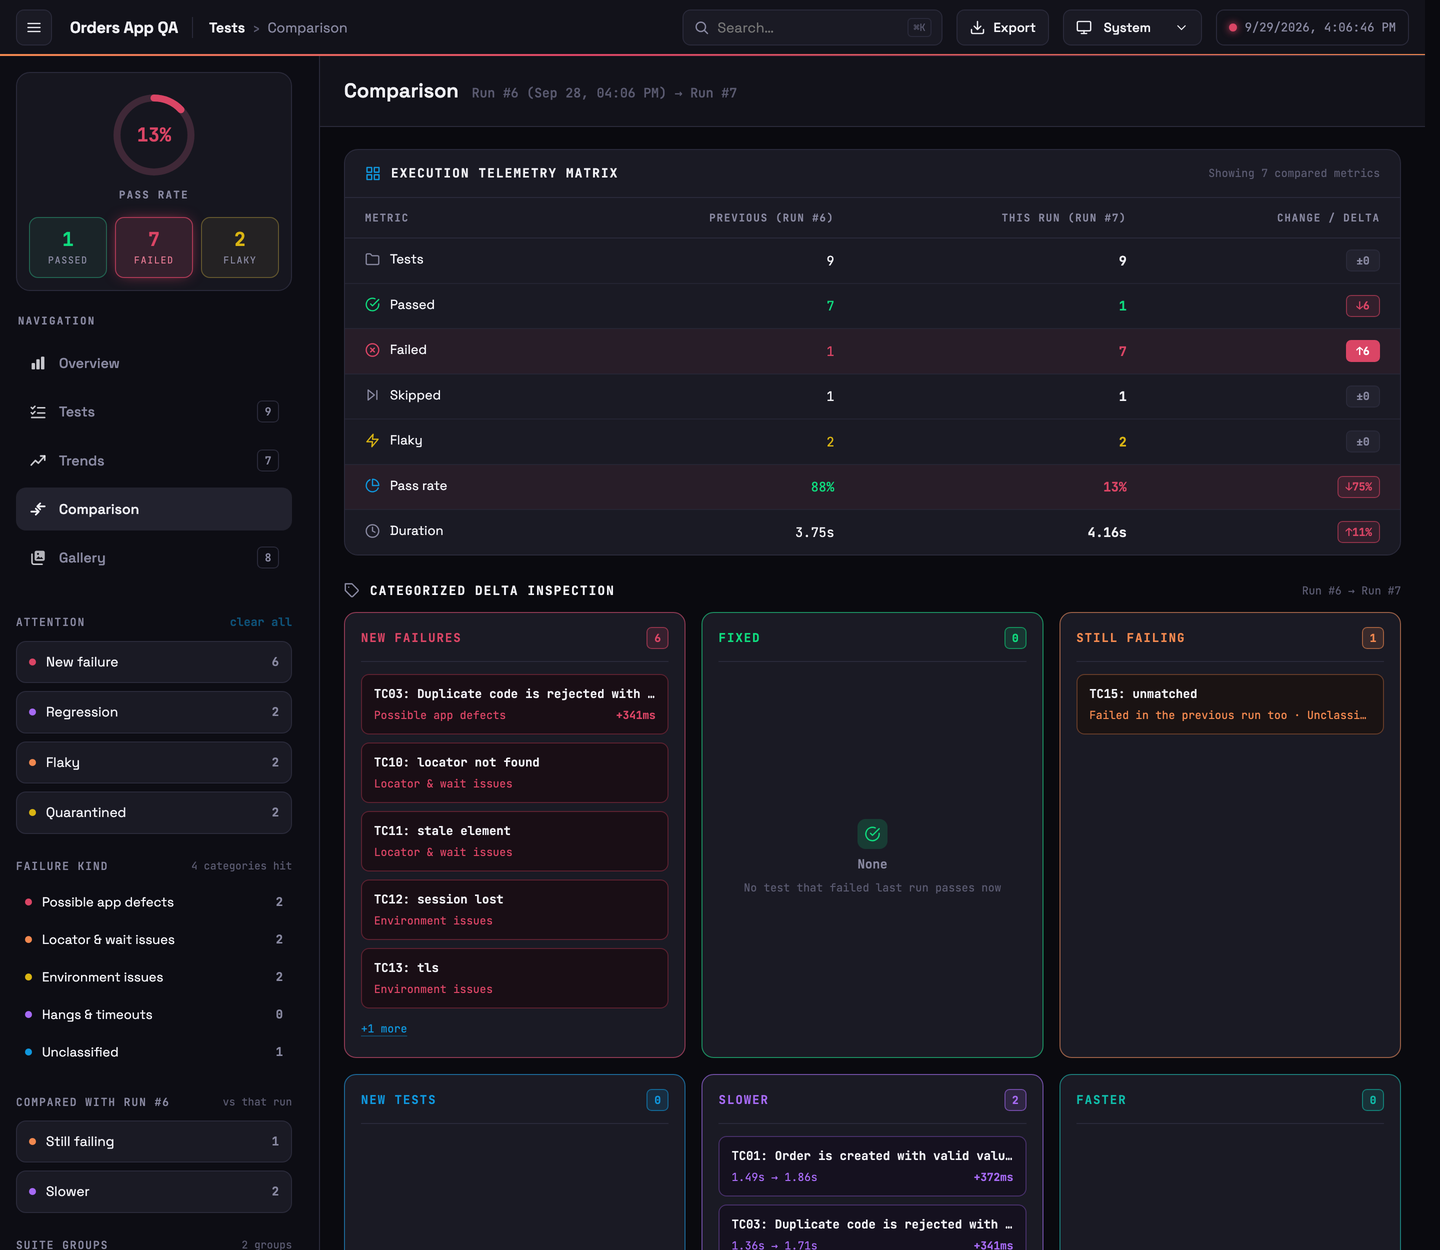
5. Comparison
This run against the previous one: every metric, then new failures, fixed, slower and faster tests.
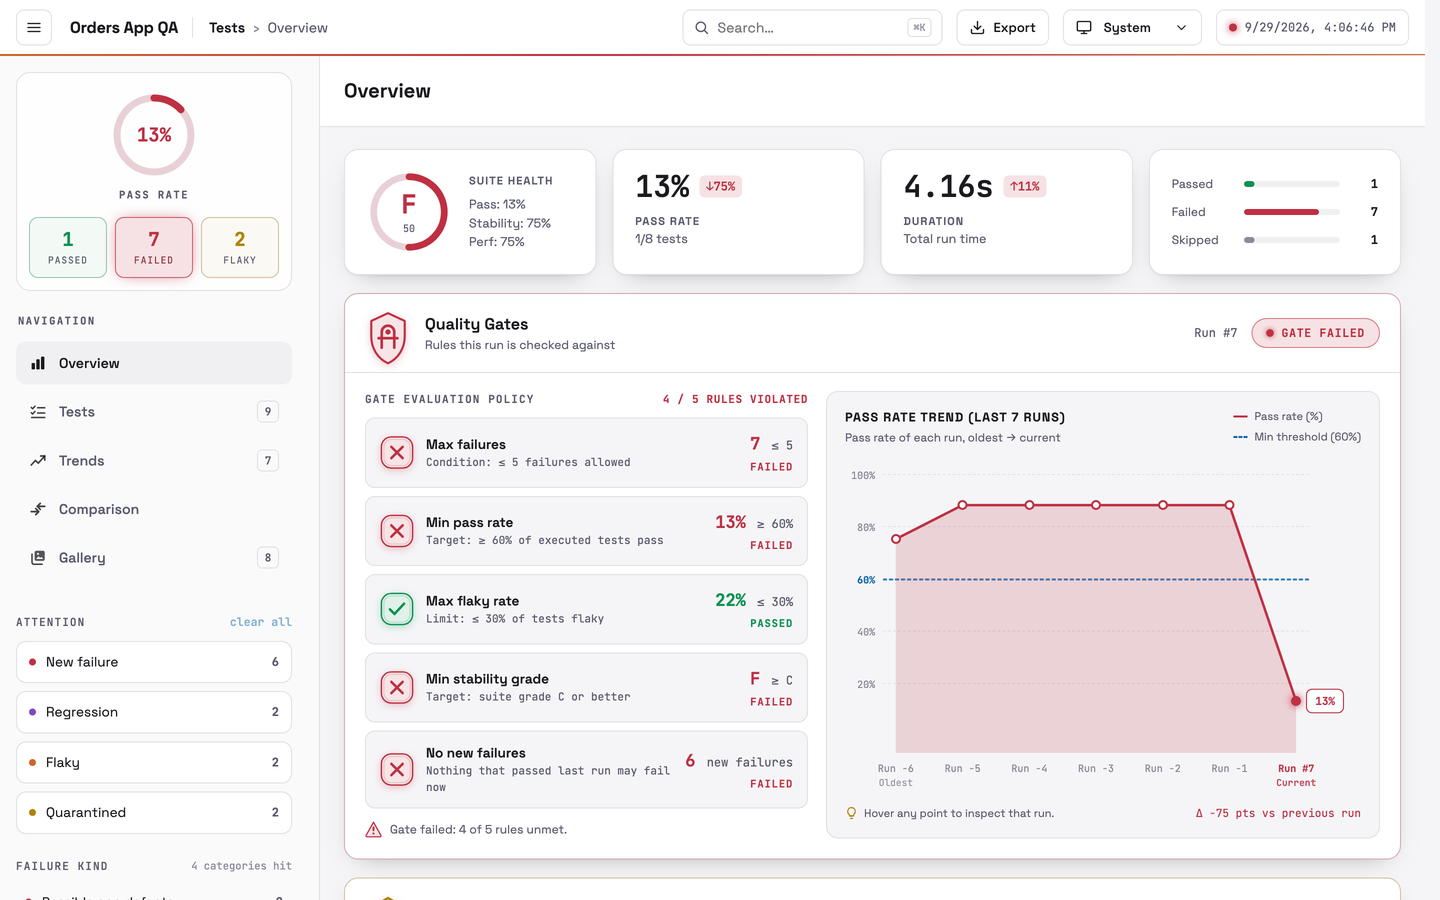
6. Light theme
One of nine themes; System follows your OS setting.
Quick start
Any runner: from JUnit XML
Point your runner's JUnit reporter at a file, then:
npx testreportium appium-reports/junit.xml
# report: appium-reports/report.html
Several files (WebdriverIO writes one per worker) merge into one report:
npx testreportium reports/junit/*.xml -o reports -p "My App QA"In CI, fail the job when a quality gate fails:
npx testreportium reports/junit/*.xml --max-failures 0 --min-pass-rate 95 --no-new-failures --fail-on-gate| Option | Default | |
|---|---|---|
| -o, --out <dir> | $TESTREPORTIUM_DIR or appium-reports | where the report goes; also where steps.jsonl, failures/ and the history live |
| -p, --project <name> | package.json name | the name in the top bar |
| -f, --filename <f> | report.html | |
| -t, --title <text> | <project> · Test Report | browser tab title |
| --no-history | | don't read or update the run history |
| --max-history <n> | 10 | runs kept in the history |
| --max-failures <n> · --min-pass-rate <pct> · --max-flaky-rate <pct> · --min-grade <A-D> · --no-new-failures | | quality gates |
| --fail-on-gate | | exit code 1 when a gate fails |
| --quarantine | | write quarantine.json |
WebdriverIO
// wdio.conf.js
import { recordSession, captureFailure, recordTest, finishRecording, StepRecorder, fromJUnit, writeReport } from 'testreportium';
import { readdirSync, readFileSync } from 'node:fs';

export const config = {
  reporters: ['spec', ['junit', { outputDir: 'appium-reports/junit' }]],

  async before() {
    await recordSession(browser); // real device, OS, app, framework → Environment block
  },

  async beforeTest(test) {
    // WDIO's JUnit classname is not the bare describe name, so pair by title.
    StepRecorder.setTest(test.title);
    await recordTest(browser); // optional: a screen recording of each test
  },
  async afterTest(test, _ctx, { passed }) {
    if (!passed) await captureFailure(browser, test.title);
    await finishRecording(browser, test.title, { keep: !passed }); // kept only for failures
  },
  onComplete() {
    const dir = 'appium-reports/junit';
    const xml = readdirSync(dir).map((f) => readFileSync(`${dir}/${f}`, 'utf8'));
    writeReport(fromJUnit(xml), { projectName: 'My App QA', qualityGates: { maxFailures: 0 } });
  },
};
Jest
// jest.config.js
reporters: [
  'default',
  ['testreportium/jest', { projectName: 'My App QA', qualityGates: { minPassRate: 95 } }],
],
Call await recordSession(driver) right after you create the session, and see
docs/reference/jest.setup.ts for capturing
the failure screenshot before teardown navigates away.
Your own runner
Build a Run (see src/model.js) and hand it to the
renderer:
import { renderReport, writeReport } from 'testreportium';
writeReport(run, { outputDirectory: 'reports' });   // or renderReport(run) → string
Recommended config
A complete reporter entry for a Jest + Appium suite: every quality gate rule set, the quarantine file on, and the options typed so a typo fails the typecheck instead of being silently ignored.
// jest.config.ts
import type { ReportOptions } from 'testreportium';

export default {
  // …preset, setupFilesAfterEnv, etc.
  reporters: [
    'default',
    ['jest-junit', { outputDirectory: 'appium-reports', outputName: 'junit.xml' }],
    ['testreportium/jest', {
      outputDirectory: 'appium-reports',
      projectName: 'My App',
      qualityGates: {
        maxFailures: 0,          // no test may fail
        minPassRate: 95,         // at least 95% of executed tests pass
        maxFlakyRate: 10,        // at most 10% of tests flaky
        minStabilityGrade: 'B',  // suite grade B or better (A–D)
        noNewFailures: true,     // nothing that passed last run may fail now
      },
      quarantine: true,          // write quarantine.json: the tests flaky enough to set aside
    } satisfies ReportOptions],
  ],
};
A rule you leave out still shows in the Quality Gates panel with this run's
value, marked Not set, and never decides the gate. The gate is reported, not
enforced: Jest's exit code stays the verdict (the CLI's --fail-on-gate exits
1 on a failed gate, for CI).
What installing gives you, and what the suite adds. A reporter only sees what the runner hands it when the run ends, so some sections need a line or two in your suite. Without them the report still works; those sections say what to add.
| In the report | Needs |
|---|---|
| Pass / fail, errors, durations, What went wrong, history, trends, comparison, flaky tests | nothing: installing is enough |
| Quality Gates rules | qualityGates, as above |
| quarantine.json | quarantine: true, as above |
| Step timeline per test | page-object actions wrapped in StepRecorder.step(), and StepRecorder.setTest() before each test (Per-step timings) |
| Failure screenshot, page source, Gallery | captureFailure(driver, title) when a test fails (Failure screenshots and recordings) |
| Screen recording of a failed test | recordTest() / finishRecording() around each test |
| Device, OS, Appium version | recordSession(driver) after the session starts |
A complete working pair is in
docs/reference/jest.config.ts and
docs/reference/jest.setup.ts.
Options
Every entry point takes the same ReportOptions. The type is exported, so a
TypeScript config gets autocomplete and catches a misspelt option or a wrong
value (maxFailure, minPassRate: '95', minStabilityGrade: 'E') before the
run, instead of the rule silently showing as Not set:
// jest.config.ts
import type { ReportOptions } from 'testreportium';

reporters: [
  'default',
  ['testreportium/jest', {
    qualityGates: { maxFailures: 0, minPassRate: 95 },
  } satisfies ReportOptions],
],
| Option | Default |
|---|---|
| outputDirectory | $TESTREPORTIUM_DIR, then appium-reports |
| projectName | $TESTREPORTIUM_PROJECT, then the name in ./package.json |
| filename | report.html |
| pageTitle | <projectName> · Test Report |
| historyFile | <outputDirectory>/testreportium-history.json; false turns history off |
| maxHistoryRuns | 10 |
| maxVideoSize | 10485760 (10 MB): the largest failure recording embedded in the report |
| flakyThreshold | 0.3, the failure share across runs that counts as flaky |
| slowerThreshold | 0.2, i.e. 20% slower than the test's average (and ≥ 100 ms) counts as a regression |
| qualityGates | none; see Quality gates |
| quarantine | off; true or { threshold, maxQuarantined, outputFile } writes quarantine.json |
| context | extra or overriding Environment rows, see Environment |
| locale, timeZone | system defaults, for the run timestamp |
StepRecorder, captureFailure and the renderer share one directory. Set
TESTREPORTIUM_DIR once to move all three.
generateReport(run, options) does the same as writeReport but returns
{ file, gates, summary, quarantined }, so your own script can act on the
gate result.
Run history
Every report adds a compact summary of its run (each test's status and
duration, no screenshots) to testreportium-history.json next to it and keeps
the last 10. That is what turns a report into a smart one:
| Where | What history adds |
|---|---|
| Overview cards | pass-rate and duration change vs the previous run (↓4%, ↑11%) |
| Suite health | grade from pass rate and stability (flakiness) and performance, not pass rate alone |
| Attention required | New failures (passed last run, fail now), Performance regressions (≥ 20% and ≥ 100 ms slower than the test's average), Flaky tests |
| Sidebar | a Flaky tile; Attention filters for new failure / regression / flaky / fixed |
| Test detail | pass/fail dots and a duration trend for the last runs, ↑48% slower / ↓20% faster |
| Trends | pass rate, duration, failed and flaky counts per run, plus a run table |
| Comparison | previous run vs this one: new failures, fixed, still failing, new and removed tests, slower and faster tests |
On the first run there is nothing to compare with. Every history-based value is then shown as absent ("New"), never estimated. A test counts as flaky when its failed share across runs is ≥ 0.3 and it has passed at least once. A test that fails every time is failing, not flaky. Re-rendering the same run replaces its history entry instead of adding a second one.
Keep the output directory between CI runs (cache or artifact) so the history survives.
Quality gates and quarantine
Gates are rules you set. The Overview shows each rule with its actual value and the limit:
qualityGates: {
  maxFailures: 0,          // failed tests allowed
  minPassRate: 95,         // % of executed tests
  maxFlakyRate: 5,         // % of tests
  minStabilityGrade: 'B',  // suite health grade
  noNewFailures: true,     // nothing that passed last run may fail now
}
The CLI prints the result, and --fail-on-gate exits with 1 when a gate fails.
The Jest adapter prints the result after the run. noNewFailures is marked as
not applicable on a first run rather than claimed as passed.
Quarantine lists the tests flaky enough to set aside, worst first, with
their flakiness score. The Overview shows the panel whenever there are
candidates. With quarantine: true (or --quarantine) the list is also
written to quarantine.json, so your runner can skip those tests:
{ "threshold": 0.3, "entries": [{ "testId": "orders.spec::Orders TC03 …", "title": "TC03 …", "flakinessScore": 0.43 }] }Environment
The sidebar's Environment block describes the device and app the run
actually used, read from the live Appium session by
recordSession(driver). Nothing is hardcoded: run on any Android or iOS
device, real or emulated, and the report shows that device.
| Row | Where it comes from |
|---|---|
| Platform | platformName + platformVersion: the OS and its version |
| Device | deviceManufacturer + deviceModel (Android), else deviceName: the maker and model |
| Framework | the app build's own files (below), else the driver (automationName: Flutter), else view-hierarchy markers; + WebView when a WEBVIEW context exists |
| App | appPackage / bundleId, else the app file name |
| Automation | automationName: the Appium driver in use |
| UDID | udid |
| Appium | the server's version from /status |
Framework detection reads evidence, not guesses. When the app
capability points to a local .apk, .ipa or .app, testreportium lists the
files inside it (only the zip index is read, so a 150 MB APK takes about 1 ms)
and looks for what each toolchain always ships:
| Detected | Marker in the build |
|---|---|
| React Native | index.android.bundle, main.jsbundle, React.framework, hermes.framework |
| Flutter | libflutter.so, flutter_assets/, Flutter.framework |
| .NET MAUI / Xamarin | libmonodroid.so, assemblies/, *.dll |
| Unity · NativeScript | libunity.so / UnityFramework.framework · libNativeScript.so |
| Capacitor / Cordova | capacitor.config.json, cordova.js |
| Native (Jetpack Compose) | META-INF/androidx.compose.* |
| Native (Android) / (iOS) | classes.dex / Info.plist with none of the above |
If there is no evidence, for example an app installed by package name only or
a cloud URL like bs://…, the row is left out rather than guessed. Fill it
with context: { Framework: 'React Native' } or APPIUM_FRAMEWORK.
Precedence, row by row: the context option, then the recorded session,
then the APPIUM_PLATFORM / _FRAMEWORK / _DEVICE_NAME / _APP_ID env
vars. Extra context keys (Build: '4.2.0') become extra rows. Several devices
in one run are all listed. Sessions recorded before the run started are
ignored, so a leftover file never shows the wrong device.
captureFailure() records the session too, so a run that only captures
failures still gets the block. Call recordSession() yourself so that
all-green runs get it as well.
Why this exists
jest-html-reporters was evaluated and rejected: it offers no template
override, and its inlineSource option inlines JS and CSS but leaves
screenshots as external files, so its 1.5 MB report.html still loses its
images the moment it is moved. Verified both ways.
This report is self-contained by contract. The design it renders was originally built on Tailwind + Font Awesome + Google Fonts over CDN; none of that survived into the code. A report that needs the network renders unstyled offline, on a locked-down corporate network, and inside many attachment viewers, which defeats the entire point of attaching it to a ticket. So all CSS is inline, every icon is an inline SVG, and the fonts are embedded as base64. The test suite asserts both properties.
Reading the report
One HTML file laid out like an app: a top bar, a sidebar, and five views. This section explains every part, and exactly when a test shows up in each one.
Terms used below:
- Executed tests are passed plus failed. Skipped tests never count towards a pass rate.
- Earlier runs come from the run history. On a first run there are none, so everything that compares runs is shown as absent, never estimated.
Top bar
| Item | What it does |
|---|---|
| ☰ Menu | collapses and expands the sidebar, so the report can use the full width. The choice is remembered per browser. On narrow screens it slides the sidebar in over the page |
| Project name | projectName, else the name in your package.json |
| Breadcrumb | where you are: Tests › Overview, or Tests › <test name> when a test is open |
| Search (⌘K / Ctrl+K) | filters the Tests list; see Search |
| Export | Results (JSON) and Results (CSV): every test with its status, duration, health, flakiness, failure kind, diagnosis and first error line, no screenshots. Print / Save as PDF: a paged document; see PDF export |
| Theme | System (follows your OS), Dark, Light, Ocean, Sunset, Dracula, Cyberpunk, Forest, Rose. Remembered per browser |
| Run time | when the run started; the dot is green when nothing failed, red otherwise |
Sidebar
| Item | What it shows | |---|---| | Pass-rate ring | passed ÷ executed, as a percentage | | Passed / Failed / Flaky tiles | counts for this run. Click one to filter the Tests list to it; click again to clear | | Navigation | Overview, Tests, Trends, Comparison, Gallery. The number is the count in that view | | Filters | narrow the Tests list; see Filters | | Environment | the device and app this run used, read from the live session; see Environment |
Filters
Filters narrow the Tests list. Clicking one opens the Tests view.
- Different groups combine (AND): New failure + Locator & wait issues shows tests that are both.
- Within a group, one choice is active at a time.
- Click an active filter again to turn it off. clear all turns every filter off.
- Suite groups and Failure kind are always shown. Failure kind lists all four kinds with their count, 0 included (a 0 cannot be clicked), plus Unclassified when a test has it. Attention only appears when it has something in it.
- To filter by status, click the Passed, Failed or Flaky tile at the top of the sidebar.
Attention (vs earlier runs)
Needs at least one earlier run. A test can carry several of these at once.
| Filter | A test is in it when |
|---|---|
| New failure | it failed in this run and passed the last time it ran |
| Regression | it is more than 20% slower than its average over earlier runs and at least 100 ms slower (so a 3 ms test "doubling" never counts). Tune with slowerThreshold |
| Flaky | it failed in at least 30% of its runs (this one included, skipped runs left out) and passed at least once. Tune with flakyThreshold |
| Fixed | it passed in this run and failed the last time it ran |
A test that has failed every time it ran is failing, not flaky: it is broken, not unstable.
Failure kind
Every failed test gets exactly one kind, from its error message. The rules are checked top to bottom, and the first one that matches wins.
| Kind | Rule: the error contains… | What it usually means |
|---|---|---|
| Possible app defects | waitForText together with timed out | the app never showed the text the test expected: a real defect, or the copy changed |
| Locator & wait issues | waitVisible, still displayed or never became visible, together with timed out / timeout | something the test waited for never appeared; if the screen is right, the locator is stale |
| Locator & wait issues | waitGone together with timed out / timeout | something that should have disappeared (a dialog, sheet, spinner) was still there |
| Locator & wait issues | still not displayed / existing / clickable / enabled after (WebdriverIO waits) | an element never reached the state the test needed |
| Locator & wait issues | no such element, NoSuchElement, element wasn't found, Can't call … on element | the locator matched nothing on the current screen |
| Locator & wait issues | stale element, StaleElementReference | the view re-rendered between finding the element and using it |
| Environment issues | UiAutomation not connected, IllegalStateException | another automation client holds the device; not a test result at all |
| Environment issues | Trust anchor, NSURLErrorDomain, certificate, SSL, CERT_ | the app's TLS connection was rejected, often device clock skew |
| Environment issues | ECONNREFUSED, socket hang up, connect ETIMEDOUT, Failed to create session | the Appium server was unreachable or refused a session |
| Hangs & timeouts | Exceeded timeout of, Async callback was not invoked (Jest), Timeout of …ms exceeded (Mocha, WebdriverIO) | the test hit the runner's timeout; the step timings show where it stalled |
| Possible app defects | an Expected: … and a Received: … line (assertion diff) | the app produced a different value than the test required |
| Unclassified | none of the above | no known failure shape matched; read the trace |
Each kind comes with a plain-language What went wrong and a concrete next step. An error that matches no rule gets no explanation, rather than a plausible-sounding wrong one. The raw trace is always shown underneath, so the explanation never replaces the evidence.
Suite groups
Spec file paths from JUnit XML: the report shows the spec file when the XML has one. Turn it on in your reporter:
addFileAttribute: 'true'forjest-junitand@wdio/junit-reporter,useFullSuiteTitle/outputsformocha-junit-reporter. Without it, the JUnit suite name stands in for the file.
One group per spec file, named by the file, for example login.spec.ts. The
describe text is not used. Two specs with the same name in different folders
are shown with their full path so they stay apart. Long names are cut with
"…"; hover to see the full name. Shown even when the run has only one group.
Search
The search box (top bar) and Filter tests… (above the Tests list) match every word you type, in any order, against the test title, its group, error message, diagnosis and step names. Search combines with the filters.
- A TC number can be typed any way.
7,07,tc07,tc-7,TC_07andtc 07all find TC-07, and only TC-07: a number on its own means the TC number, so7does not also match17or a 7.69 s duration. (In a run with no TC numbers, numbers match as ordinary text.) - Dashes, underscores and colons are ignored, so
signinfinds "sign-in".
Skipped tests have no filter of their own. Search for skipped to list them.
Overview
| Part | What it shows |
|---|---|
| Suite health | an A–F grade: A ≥ 90, B ≥ 80, C ≥ 70, D ≥ 60, otherwise F. On a first run it is the pass rate. With history it is 40% pass rate + 35% Stability + 25% Perf |
| Stability | 100 minus the average flakiness of all tests that have history |
| Perf | the share of timed tests that did not regress |
| Pass rate | passed ÷ executed, with the change in points vs the previous run (↓75%) |
| Duration | wall-clock time of the run, with the change vs the previous run in % |
| Status breakdown | passed, failed and skipped, as bars |
| Quality Gates | always shown. Without qualityGates it is a small Not configured panel that says how to add rules. With them: all five rules, each with its condition, actual value and PASSED / FAILED. A rule you did not set still shows this run's value (0 included), marked Not set, and never decides the gate, plus a pass-rate chart for the last runs with your minimum as a dashed line. Hover any point to see that run's pass rate, counts, gate result and new failures |
| Quarantine Registry | always shown. On a first run it says Needs history; with history and no flaky test it says 0 flaky. Otherwise it lists every test flaky enough to quarantine: at least the threshold (default 0.30), mixed passes and fails. Each test with its score and how often it failed, plus a chart of how many tests were flaky at each run. It says quarantined when quarantine is on (the list is written to quarantine.json), otherwise flagged |
| Attention required | cards for new failures, performance regressions and flaky tests (only those with a count). Click one to filter the Tests list |
| Failure breakdown | always shown: one card for each of the four failure kinds with its count, 0 included, plus Unclassified when a test has it. Click a card to filter |
| Failure clusters | failures that share a cause, grouped: the same diagnosis, or the same first error line with numbers ignored. One cluster with many tests usually means one root cause |
| Quick insights | the slowest test; the most flaky test (or, without history, the slowest step); and a pass-rate strip per run: green ≥ 90%, yellow ≥ 70%, red below |
| Test duration profile | one bar per test (first 40), coloured by status. Click a bar to open that test |
| Pass ratio | a ring of passed, failed and skipped, with pass rate, total duration and suite count |
Tests
A list grouped by suite beside a detail pane. Each list row shows the TC ID,
title, failure kind (or step count) and duration, plus tags such as
New failure, Flaky, Regression or Fixed.
Filters and Search narrow the list. j / k move
through it, and links like report.html#t3 open one test directly.
Detail header chips:
| Chip | Meaning |
|---|---|
| Health | New (no earlier run), Stable (flakiness under 10%), Unstable (10% to 30%), Flaky (30% or more, with at least one pass), Failing (failed every time), Skipped |
| Failure kind | see Failure kind |
| Status | Passed, Failed or Skipped |
| ↑48% slower / ↓20% faster | this run vs the test's average over earlier runs; shown when the change is 5% or more |
Detail sections, in order:
| Section | What it holds |
|---|---|
| What went wrong | the diagnosis sentence and the next step (failed tests with a known failure kind) |
| Run history | pass / fail dots for the last 10 runs of this test (the ringed dot is this run), its pass rate across them, and a duration bar per run with the average |
| Step timeline | every recorded step as a coloured segment. Colours come from the step's first word: Navigation (open, navigate, go, launch, back, restart, activate), Action (tap, click, press, swipe, scroll, drag, long, double, hide), Input (fill, type, enter, set, select, clear, choose, pick), Wait / check (wait, expect, assert, verify, check, see, read, get), Other, and Failed. The slowest step is marked; a failed step shows its error |
| Full error & stack trace | the raw error. Frames from your own code are highlighted; frames from node_modules and Node internals are dimmed |
| Device at failure | the screenshot captured when the test failed (click to enlarge) and, if you record tests, the screen recording beside it |
Trends
Needs at least one earlier run. The last 10 runs are kept.
| Card | Right side | Badge wording | |---|---|---| | Pass rate | the previous run's rate as the baseline | points vs the previous run: Critical (down 20 or more), Drop (down), Improved (up), Stable (no change). A critical drop into this run is drawn in red | | Duration | the slowest run | Surge (more than 10% slower than the previous run), Faster (more than 10% faster), Steady otherwise | | Failed tests | tests in this run | this run's failures and the change vs the previous run | | Flaky tests | the highest flaky count | Rising, Falling or Stable flakiness, with this run's count |
Hover any point or bar for that run's details, including which tests failed or were flaky. The current run is highlighted in every chart.
Historical runs execution matrix: one row per run, newest first. Pass rate is yellow below 80% and red below 60%; ↘ / ↗ mark a fall or rise vs the run before. This run links to its Report. Click › on a past run to see its failed tests, flaky tests and gate result, recalculated from the history.
Comparison
This run against the one right before it.
Execution telemetry matrix: tests, passed, failed, skipped, flaky, pass rate and duration, side by side, each with a change badge. The badge is grey for no change, green when better and red when worse. More failures get a solid red badge. Rows that got worse (failed, flaky, pass rate) are tinted.
Categorized delta inspection:
| Card | A test is in it when | |---|---| | New failures | it failed now and passed the last time it ran | | Fixed | it passed now and failed the last time it ran | | Still failing | it failed in both runs | | New tests | it was not in the previous run | | Slower | it ran in both runs and took at least 100 ms longer than in the previous run | | Faster | it ran in both runs and took at least 100 ms less | | Removed tests | it was in the previous run but not in this one (the card only appears when there are some) |
Slower here is not the same as the Regression filter.
| | Compares against | Threshold | |---|---|---| | Slower (Comparison) | the previous run only | a plain 100 ms | | Regression (Attention filter) | the test's average over all earlier runs | more than 20% and at least 100 ms |
Skipped tests are never slower or faster.
Gallery
Every screenshot and recording from the run. The header counts screenshots, recordings and failure captures (failed tests with any media).
| Part | What it does |
|---|---|
| All / Screenshots / Videos | show everything, only screenshots, or only recordings |
| Sort | Failures first (default), By test order, By suite, By failure kind, or Recordings first. Every sort but test order puts a heading with a count above each group (e.g. Possible app defects · 2), so you can see where a group starts and check it |
| Suite line | every card names its suite and spec file (TC numbers repeat across specs), for example Login · specs/login.e2e.ts |
| Kind line | the card's failure kind, in the same colour as the sidebar filter; a passed test's card says Passed · no failure |
| Cards | one for every capture, three per row, all the same size: screenshot and recording side by side (REC with its length), or the screenshot alone, then the TC, status, suite and spec, title and diagnosis. Click the screenshot for fullscreen, play the recording in place, click the text to open the test |
A passed test appears only if you kept its recording
(finishRecording(..., { keep: true })), and only a recording made during
this run, so a video left over from an earlier failure never shows against a
test that now passes. Screenshots only ever belong to failed tests.
PDF export
Export → Print / Save as PDF prints the whole report:
- A4 pages, light colours, with each view on a new page.
- No card, chart, table row or test block is split across pages.
- Stack traces are printed in full.
- Hover-only hints are left out.
To remove the file path and page numbers the browser adds at the top and bottom, untick Headers and footers in the print dialog.
Look and feel
- Themes: Dark is the default, with neon green, red and yellow for pass, fail and skip.
- Fonts: Space Grotesk and JetBrains Mono are embedded (latin subset,
about 54 KB, SIL OFL 1.1, licences in
assets/fonts/). Regenerate them withnpm run fontsafter changing a font file.
Per-step timings
Test runners hand a reporter only a total duration per test; there is no
step breakdown to read. So steps are recorded as they happen:
StepRecorder.step() times each call and appends one line to steps.jsonl,
which the renderer reads back at the end of the run.
import { StepRecorder } from 'testreportium';

async tap(el: WebdriverIO.Element, description: string) {
  return StepRecorder.step(`tap ${description}`, async () => { /* … */ });
}
Wrap your page-object base class once and every page object produces steps for
free. Call StepRecorder.setTest(name) before each test so steps pair with it.
name is the describe blocks plus the title, space-joined (what Jest calls
currentTestName), or just the test title. The report tries the full name
first, then the title.
Two guarantees hold:
- It always re-throws. Swallowing there would hide a real defect.
- A recording failure is silently ignored. Instrumentation must never fail a test. A reporter that can redden a green run is a source of false findings.
Failure screenshots and recordings
captureFailure(driver, testTitle) writes the screenshot and page source into
<outputDirectory>/failures/, named so the report pairs them with the test.
Both sides use the one slug() from testreportium/slug, so they cannot drift
apart. In the project this grew out of, two copies did exist, and if they ever diverged every
screenshot would silently vanish from the report.
Screen recordings show how a test got to its failure. Wrap each test:
await recordTest(driver);                                   // before the test
await finishRecording(driver, testTitle, { keep: failed }); // after it
finishRecording keeps the video only when keep is true, so passing tests
leave nothing behind. The file sits next to the screenshot and appears beside
it in the test's Device at failure section and in the Gallery.
| | Android (UiAutomator2) | iOS (XCUITest) | |---|---|---| | Needs | nothing extra: the device's own screen recorder | ffmpeg installed on the machine running Appium | | Default settings | 2 Mbps, up to 180 s | medium quality, 10 fps, up to 180 s |
Change the settings with recordTest(driver, { recordingOptions: { … } }),
passed straight to Appium's startRecordingScreen. Screens the app marks as
secure (payment pages, for example) record as black on Android.
Size: each recording is embedded in the report up to maxVideoSize (10 MB
by default), so the report stays one file you can attach. A bigger recording
is not embedded; the report says so and names the saved file instead. The PDF
keeps the screenshot and notes that a recording exists. Neither helper ever
throws, so a recording problem can never fail or hide a test.
Never replaces JUnit XML
This report is purely human-facing and strictly additive. Keep a JUnit reporter for anything machine-readable: CI gates, dashboards, trend tooling.
Repository layout
src/model.js                   the runner-neutral Run / Suite / Test shape
src/render.js                  Run → one self-contained HTML file (zero deps)
src/diagnose.js                failure → plain-language cause, next step, kind
src/history.js                 run history: flakiness, regressions, gates, quarantine
src/fonts.js                   GENERATED: embedded fonts (scripts/embed-fonts.mjs)
src/adapters/junit.js          JUnit XML → Run (any runner)
src/adapters/jest.js           Jest reporter + AggregatedResult → Run
src/cli.js                     the `testreportium` command
src/capture.js                 failure screenshot + page source
src/session.js                 live session → Environment rows, framework detection
src/step-recorder.ts           times each step, writes steps.jsonl
src/slug.js, src/paths.js      the shared naming and directory contracts
assets/fonts/                  the woff2 sources and their OFL licences
scripts/demo.mjs               `npm run demo`: builds and opens demo/report.html
scripts/embed-fonts.mjs        `npm run fonts`: regenerates src/fonts.js
docs/screenshots/              the README screenshots (not in the npm package)
docs/reference/                how the Jest adapter is wired in a real project
docs/ROADMAP-report-tiles.txt  the original test plan for the clickable tiles
test/*.test.mjs                the test suite (node --test), run against dist/
test/fixtures/                 a REAL captured run, the golden fixture
CHANGELOG.md                   what changed in each release; "Unreleased" is next
test/fixtures/ is a genuine run: junit.xml, steps.jsonl and failure
artefacts. expected-report.html is the golden output rendered from them;
after an intended visual change, regenerate it with UPDATE_GOLDEN=1 npm test.
npm run demo builds demo/report.html from the current code (fixtures plus a
simulated run history, so every view has data) and opens it.
Releasing
- Bump
versioninpackage.json. npm publish.prepublishOnlybuildsdist/and runs every test first, so a failing build or test stops the release.
Only dist/, README.md, LICENSE and the font licences are published
(npm pack --dry-run lists them).
Roadmap
- Native Mocha and WebdriverIO reporter adapters, so no JUnit step is needed.
Known gap
The original design assets (code.html, DESIGN.md, and the screen.png
mockup the dashboard was built to match) were never committed to the original
repository (they were gitignored) and are missing from disk. They are not
required to run or modify the renderer, but if a copy turns up, it belongs in
design/.
Licence
MIT