
tuimon
v0.3.52
Published
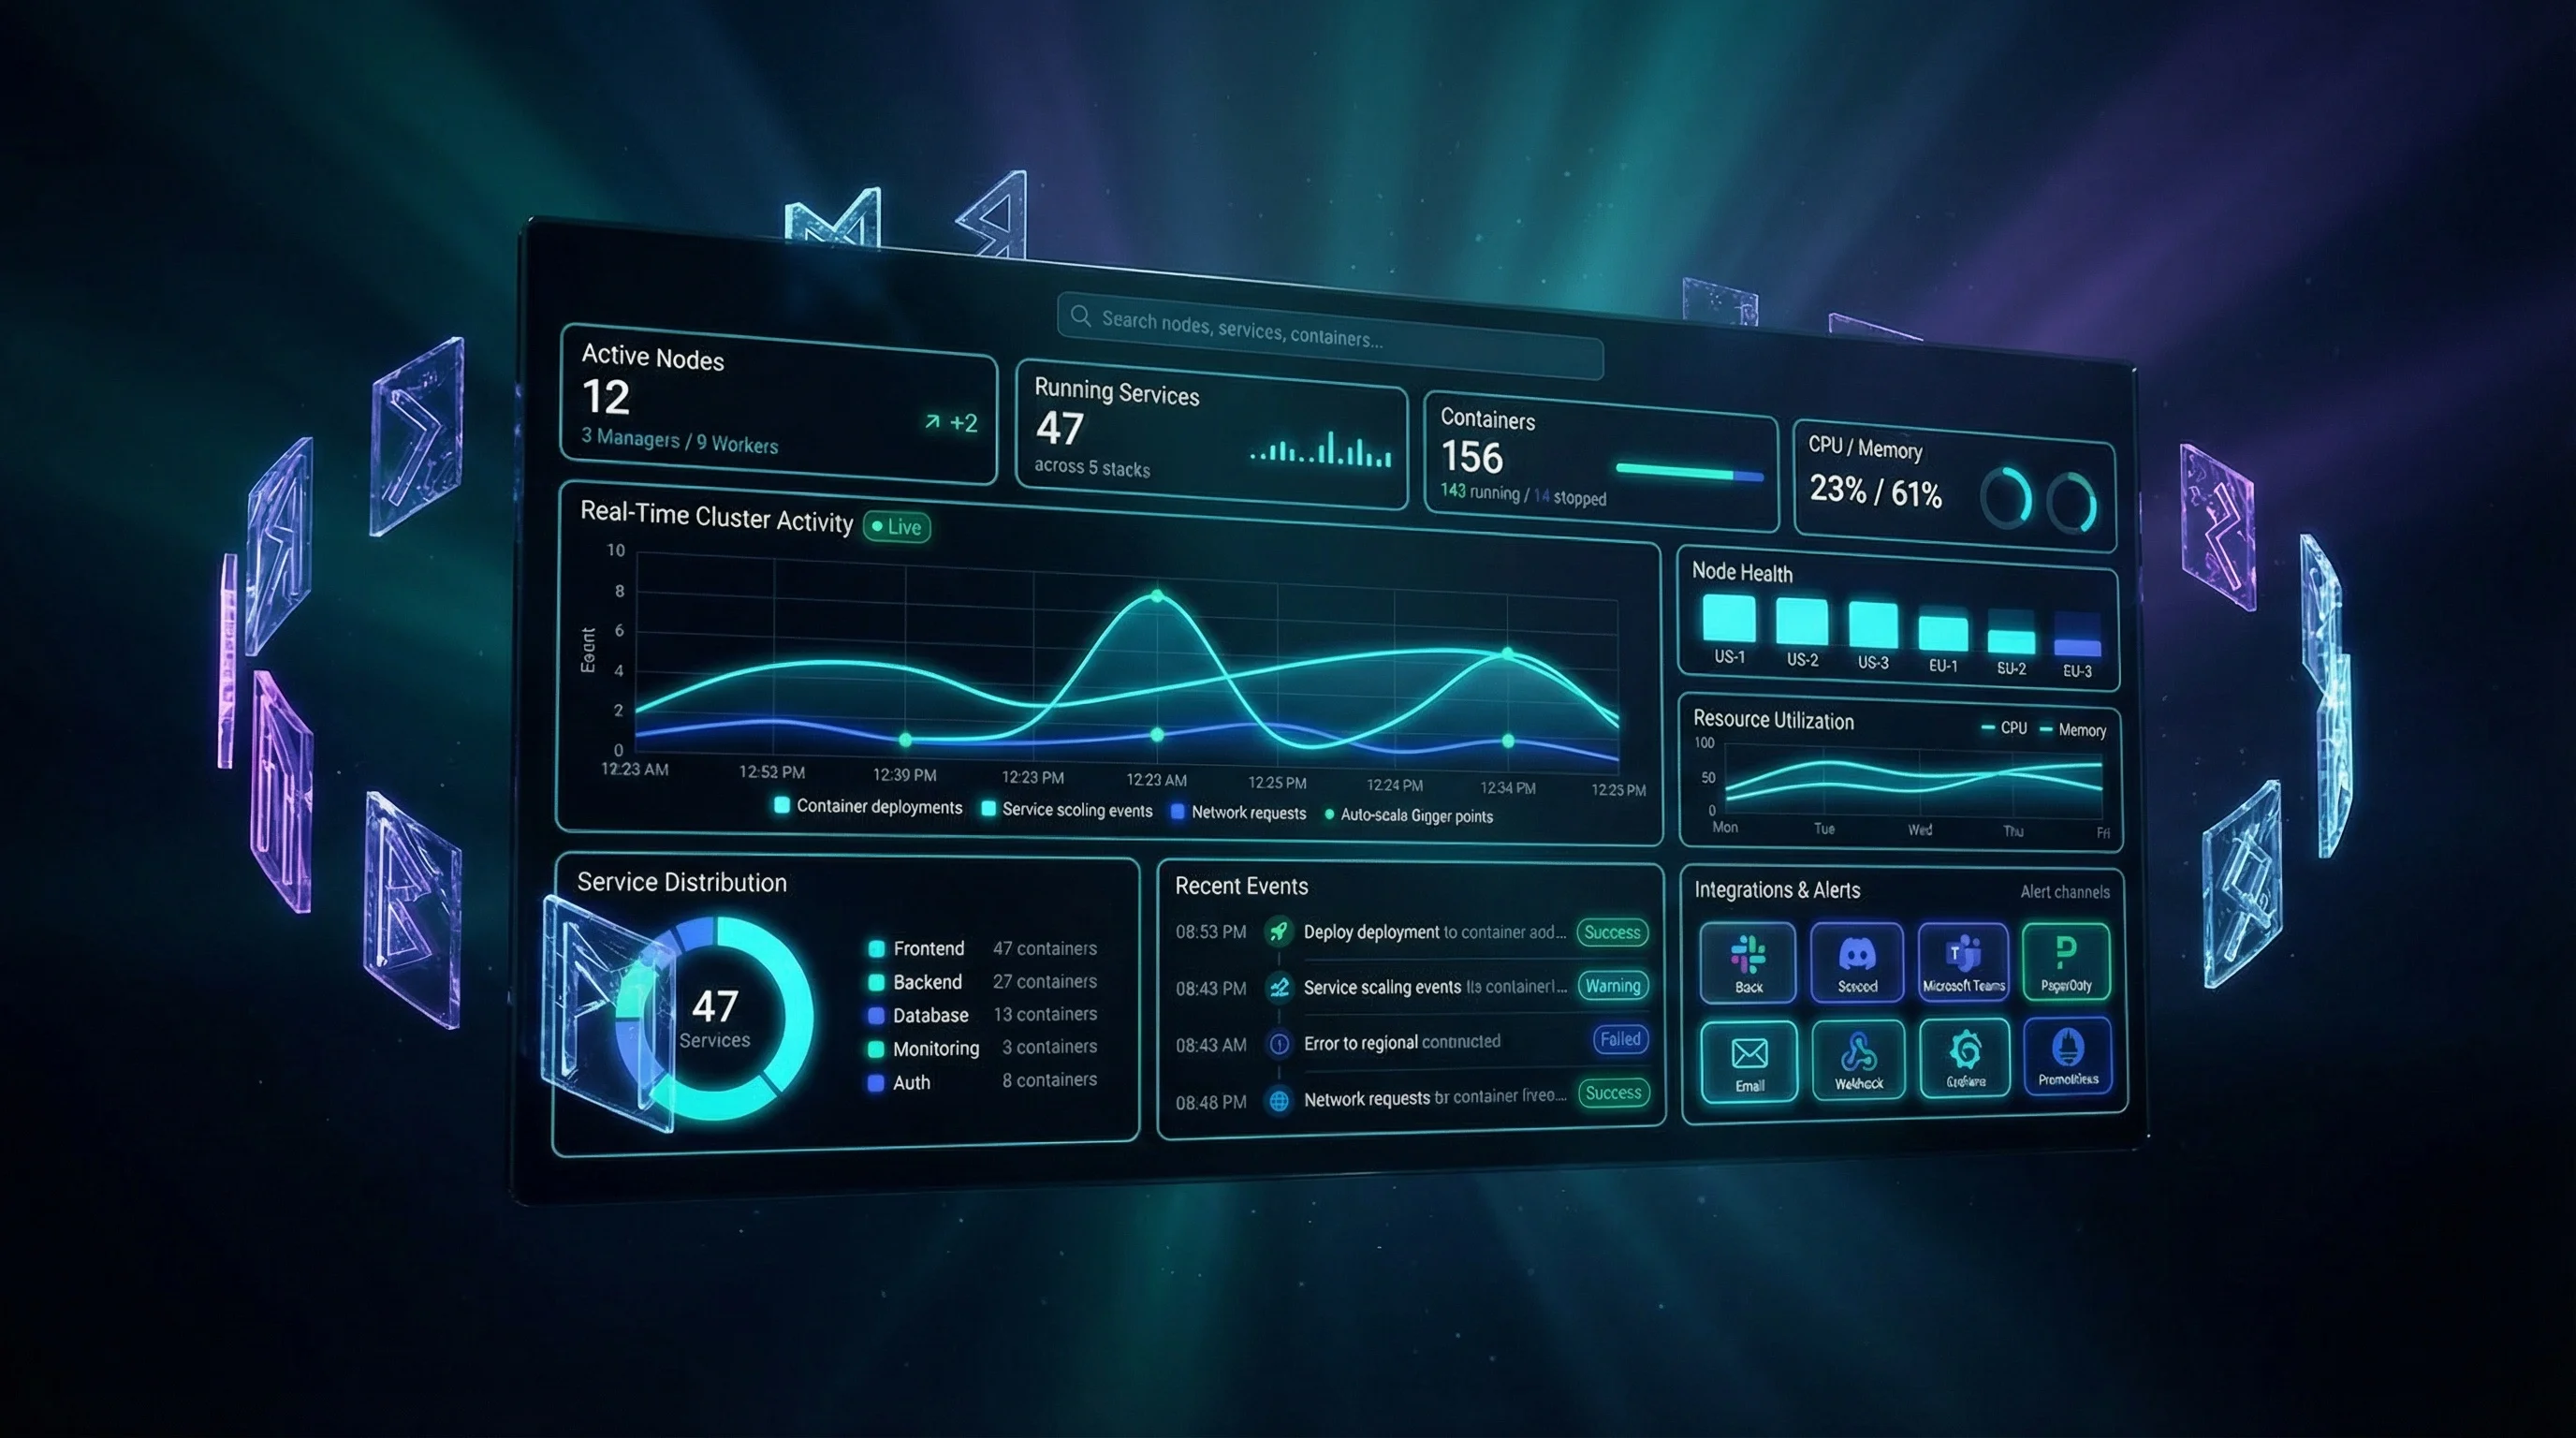
Render beautiful HTML dashboards directly in your terminal.

Readme
TuiMon
View the full documentation site
Your HTML, CSS, and JavaScript, rendered directly in the terminal.
What Is TuiMon?
TuiMon takes any HTML page and renders it live in your terminal. Write your dashboard with HTML, CSS flexbox, Chart.js, D3, or whatever you already know, and TuiMon turns it into a real-time terminal application.
No curses. No blessed. No terminal UI framework. Just the web tech you already use.
Your HTML/CSS/JS > Headless Chromium > Screenshot > Terminal Graphics > Your TerminalIf it works in a browser, it works in TuiMon.
But you don't have to write HTML if you don't want to. TuiMon also comes with a beautiful built-in theme and a set of zero-config CLI tools that let you visualize files, databases, and live data without writing a single line of HTML.
Quick Start
npm install -g tuimon
tuimon init       # scaffolds a starter dashboard
tuimon start      # renders it in your terminal
1. Build Your Own Dashboard with HTML
This is what TuiMon was built for. You write your dashboard as a normal HTML page. Use CSS flexbox, grid, animations, whatever. Use any charting library. TuiMon renders it in your terminal.
<!-- pages/dashboard.html -->
<div style="display: flex; gap: 20px; padding: 20px; background: #0a0e1a; color: white; height: 100vh;">
  <div style="flex: 1; background: #0f1629; border-radius: 8px; padding: 16px;">
    <h3>CPU Usage</h3>
    <canvas id="cpuChart"></canvas>
  </div>
  <div style="flex: 1; background: #0f1629; border-radius: 8px; padding: 16px;">
    <h3>Memory</h3>
    <div id="memValue" style="font-size: 48px; color: #00e5ff;">--</div>
  </div>
</div>
<script src="https://cdn.jsdelivr.net/npm/chart.js@4"></script>
<script>
  TuiMon.onUpdate(function(data) {
    TuiMon.set('#memValue', data.memory + '%')
    // update your charts, DOM, anything you want
  })
</script>
// tuimon.config.ts
import tuimon from 'tuimon'
const dash = await tuimon.start({
pages: {
main: {
html: './pages/dashboard.html',
default: true,
keys: {
F5: { label: 'Refresh', action: async () => dash.render(await getData()) },
F10: { label: 'Quit', action: () => process.exit(0) },
},
},
},
refresh: 1000,
data: getData,
})Multiple Pages
You can define multiple HTML pages and let users switch between them with keyboard shortcuts. Press a letter to jump to a detail page, ESC to go back.
pages: {
  overview: { html: './pages/overview.html', default: true },
  cpu:      { html: './pages/cpu-detail.html', shortcut: 'g', label: 'CPU Detail' },
  memory:   { html: './pages/memory-detail.html', shortcut: 'm', label: 'Memory' },
}
Client Library
TuiMon automatically injects a small client script into your HTML pages. You use it to receive data updates:
TuiMon.onUpdate(callback)receives data wheneverdash.render(data)is calledTuiMon.set(selector, value)is a shortcut to update text content or stylesTuiMon.notify(message)dispatches a notification event
Shortcut Badges
Add data-tm-key="g" to any element and TuiMon automatically renders a [G] badge in the corner. Users immediately know they can press G to navigate there.
F-Key Bar
Each page can define its own F-key bindings. The bar at the bottom of the terminal always shows the active page's keys.
Mouse Support
Add mouse: true to your start options:
const dash = await tuimon.start({
  pages: { ... },
  mouse: true,
})
That is all it takes. You now have a fully interactive browser running inside your terminal.
Left clicks fire real browser click events at the exact pixel position. Right-click is mapped to hover - it dispatches a mousemove at that position, so right-clicking a chart series fires its tooltip. There is no passive hover (moving the terminal cursor does not trigger mouseover events), but right-click gives you a direct way to inspect any point. Scroll wheel scrolls whatever element is under the cursor. Every interaction triggers a re-render so the display updates immediately.
What this means in practice: if it responds to click and scroll events in a real browser, it responds in TuiMon. Click a button in your HTML and the handler fires. Scroll a long table and it scrolls. Right-click a chart data point and the tooltip appears. Your terminal dashboard is not simulating interactivity - it is running it.
| Input | Behavior | |-------|----------| | Left click | Real browser click at cursor position | | Right click | Mapped to hover - fires mousemove at that position | | Scroll up/down | Wheel scroll on the element under the cursor |
Mouse mode uses SGR extended mouse reporting. Every supported terminal (Kitty, Ghostty, WezTerm, iTerm2, VSCode) already has this - no extra configuration needed.
2. Use the Built-in Theme (No HTML Needed)
If you don't want to design anything, TuiMon comes with a built-in dark neon theme. Just define your widgets and push data. TuiMon generates the HTML for you behind the scenes.
const dash = await tuimon.start({
  pages: {
    main: {
      default: true,
      layout: {
        title: 'My App',
        stats: [
          { id: 'users', label: 'Users Online', type: 'stat' },
          { id: 'cpu', label: 'CPU', type: 'gauge' },
        ],
        panels: [
          { id: 'traffic', label: 'Traffic', type: 'line', span: 2 },
          { id: 'services', label: 'Services', type: 'doughnut' },
          { id: 'events', label: 'Events', type: 'event-log', throttle: 2000 },
          { id: 'health', label: 'Health', type: 'status-grid', throttle: 5000 },
        ],
      },
    },
  },
  refresh: 500,
  data: () => ({
    users: 42,
    cpu: 73,
    traffic: { Requests: 340, Errors: 12 },
    services: { Web: 47, API: 27 },
    events: ['Deploy completed'],
    health: ['Node-1', 'Node-2'],
  }),
})
Widget Types
There are 8 built-in widget types: stat, gauge, line, doughnut, bar, event-log, status-grid, and table.
Just Send Numbers
You don't need to learn a data format. Just send the simplest thing and TuiMon figures it out:
| What you send | What TuiMon shows |
|---------------|-------------------|
| 42 | Stat card with the number |
| 73 (for something named cpu or mem) | Gauge bar showing 73% |
| { Requests: 340, Errors: 12 } | Line chart that builds up over time |
| ['Deploy completed'] | Event log with automatic timestamps |
| ['Node-1', 'Node-2'] | Status grid with green dots |
For line charts, you don't manage history. Each render call sends the current values and TuiMon accumulates the history automatically.
Per-Widget Throttle
Each widget can update at its own speed. Your charts can update every frame while your event log only updates every 2 seconds and your status grid every 5 seconds. Just add throttle: 2000 to any widget config.
3. Instant Visualization (Zero Setup)
Sometimes you just need to quickly look at some data. TuiMon can do that too.
View a File
tuimon data.json                    # JSON array of objects, shown as table + charts
tuimon users.csv                    # CSV file, auto-detects delimiter
tuimon access.log                   # Nginx access log, shows request stats
tuimon modsec_audit.log             # ModSecurity log, shows security dashboard
tuimon data.json -c "name,age"      # Only show specific columns
You can also render any HTML file directly in the terminal:
tuimon dashboard.html # render any HTML page in the terminalTuiMon auto-detects the file format, picks the right widgets, and builds a dashboard. It also watches the file for changes so the dashboard updates if the file is modified.
Press D to switch to a full-screen data table. Use arrow keys to page through the data. ESC goes back.
Built-in Dashboards
TuiMon comes with ready-made dashboards for common developer tasks. No setup, no config files. Just run the command.
Docker shows a live container dashboard with CPU and memory line charts, a container details table showing Net I/O, Block I/O, and PIDs, and a full docker logs viewer on a second page.
tuimon docker # live dashboard, press L for container logsGit analyzes your repository and shows commit frequency over the last 30 days, top contributors, the most changed files, and recent commits.
tuimon git # run from any git repoProcess Monitor shows live CPU and memory usage per process, load average, and a full process table with PID, user, CPU%, memory%, VSZ, RSS, and state.
tuimon ps # live dashboard, press P for full process tableDependencies parses your lock file and shows total dependencies, direct vs dev, duplicates, version conflicts, and a browsable dependency table.
tuimon package-lock.json # also works with yarn.lockTest Coverage parses coverage reports and shows coverage percentage per file, distribution, and highlights low coverage files. Supports Istanbul JSON, lcov, and JUnit XML for test results.
tuimon coverage.json      # Istanbul JSON
tuimon coverage.lcov      # lcov format
tuimon results.xml        # JUnit XML test results
npm Downloads shows a live download dashboard for any set of npm packages. Pass the package names as arguments and get daily trend charts, total counts by period, and a per-package breakdown with version info.
tuimon npm @markdownai/core @markdownai/engine strictdb
tuimon npm                        # reads from .tuimon-npm.json if present
The dashboard has three date ranges (last week, last month, last year) selectable with clickable buttons at the top - using TuiMon's mouse support. Each package gets a shortcut key ([A], [B], ...) to open a detail view with version, description, and daily download history. The data auto-refreshes every 5 minutes.
You can also persist your package list in a config file so you don't have to type it every time:
{ "packages": ["@markdownai/core", "strictdb", "mdd"] }Save that as .tuimon-npm.json in your project root and tuimon npm picks it up automatically.
Watch Live Data
Create a JS file that exports a function returning your data:
// metrics.js
const os = require('os')
module.exports = () => ({
  cpu: getCpuPercent(),
  memory: getMemPercent(),
  uptime: process.uptime(),
})
tuimon watch metrics.jsTuiMon calls your function every second, auto-detects the data shape, and builds a dashboard.
You can also poll an HTTP endpoint that returns JSON:
tuimon watch --url http://localhost:3000/metrics
tuimon watch --url http://localhost:3000/metrics --interval 5000
View a Database Table
If you are working on a project that already has a database driver installed and a connection string in .env, you can view your data directly:
tuimon db users                          # view a table or collection
tuimon db users --watch                  # re-query every 2 seconds
tuimon db "SELECT * FROM orders"         # run a custom query
tuimon db users --query '{"active":true}'  # MongoDB filter
tuimon db users --env MY_DB_URI          # use a specific env variable
tuimon db users -c "name,email,role"     # only show these columns
TuiMon finds the database driver in your project's node_modules/ folder and reads the connection string from your .env file. It supports MongoDB, PostgreSQL, MySQL, and SQLite.
No new dependencies are installed. TuiMon uses whatever driver your project already has.
Terminal Support
| Terminal | Protocol | Status | |----------|----------|--------| | Kitty | Kitty | Supported | | Ghostty | Kitty | Supported | | WezTerm | Kitty | Supported | | iTerm2 | iTerm2 | Supported | | VSCode | Sixel | Supported | | mlterm | Sixel | Supported |
VSCode
Running tuimon init automatically enables terminal images in VSCode. It creates a .vscode/settings.json file with:
{ "terminal.integrated.enableImages": true }If you are adding TuiMon to an existing project, add that setting manually or run tuimon init.
Global Config
You can set preferences once so you don't have to repeat them:
tuimon config db.envVar MONGODB_URI    # which env var holds your DB connection
tuimon config db.defaultLimit 500      # how many rows to show by default
tuimon config refresh 250              # default refresh rate in ms
tuimon config                          # show current config
tuimon config --reset                  # reset everything to defaults
Config is stored in ~/.tuimon/config.json.
CLI Reference
| Command | What it does |
|---------|--------------|
| tuimon <file> | Visualize a JSON, CSV, log, or HTML file |
| tuimon npm [packages...] | npm downloads dashboard with date range switching |
| tuimon docker | Live Docker container dashboard (press L for logs) |
| tuimon git | Git repository analysis dashboard |
| tuimon ps | Live process monitor (press P for full table) |
| tuimon package-lock.json | Dependency analysis |
| tuimon coverage.json | Test coverage or JUnit test results |
| tuimon watch <file.js> | Live dashboard from a JS data module |
| tuimon watch --url <url> | Poll a JSON endpoint |
| tuimon db <table or query> | View a database table or run a query |
| tuimon start | Run a custom HTML dashboard from tuimon.config.ts |
| tuimon init | Scaffold a starter project and enable VSCode |
| tuimon check | Check if your terminal supports graphics |
| tuimon config | View or set global preferences |
| tuimon ai | Print the AI integration guide |
Set TUIMON_DEBUG=1 to print per-frame timing to stderr.
How It Works
TuiMon runs a headless Chromium browser via Playwright. Your HTML page loads in the browser. TuiMon pushes data into the page, takes a PNG screenshot, encodes it using the Kitty graphics protocol (or Sixel for terminals that need it), and writes it to stdout. The F-key bar and keyboard input run natively in the terminal. With mouse: true, terminal click and scroll events are translated to browser pixel coordinates and dispatched as real browser events, making the dashboard fully interactive.
A typical frame takes about 50ms from data push to pixels on screen.
Contributing
Tests first, implementation second. Coverage thresholds are 80% lines, 80% functions, and 75% branches. TypeScript is strict with no exceptions.
License
MIT