
usagecc
v0.1.1
Published
A local dashboard for what you spend on AI coding agents, split by model vendor

Maintainers
 tony-nguyen-vn
Readme
usagecc
See what you are actually spending on AI coding agents, split by who makes the model.
You probably run more than one agent -- Claude Code, Codex, Droid, Gemini CLI, OpenCode. Each one reports its own usage, and none of them tells you the thing you want to know: where the money is going, and whether the expensive one is earning it.
usagecc reads the usage logs those tools already write on your machine and opens a dashboard
in your browser.
npx usageccThat is the whole setup. Nothing to configure, no API keys, no account. Your data never leaves the machine.
What you get
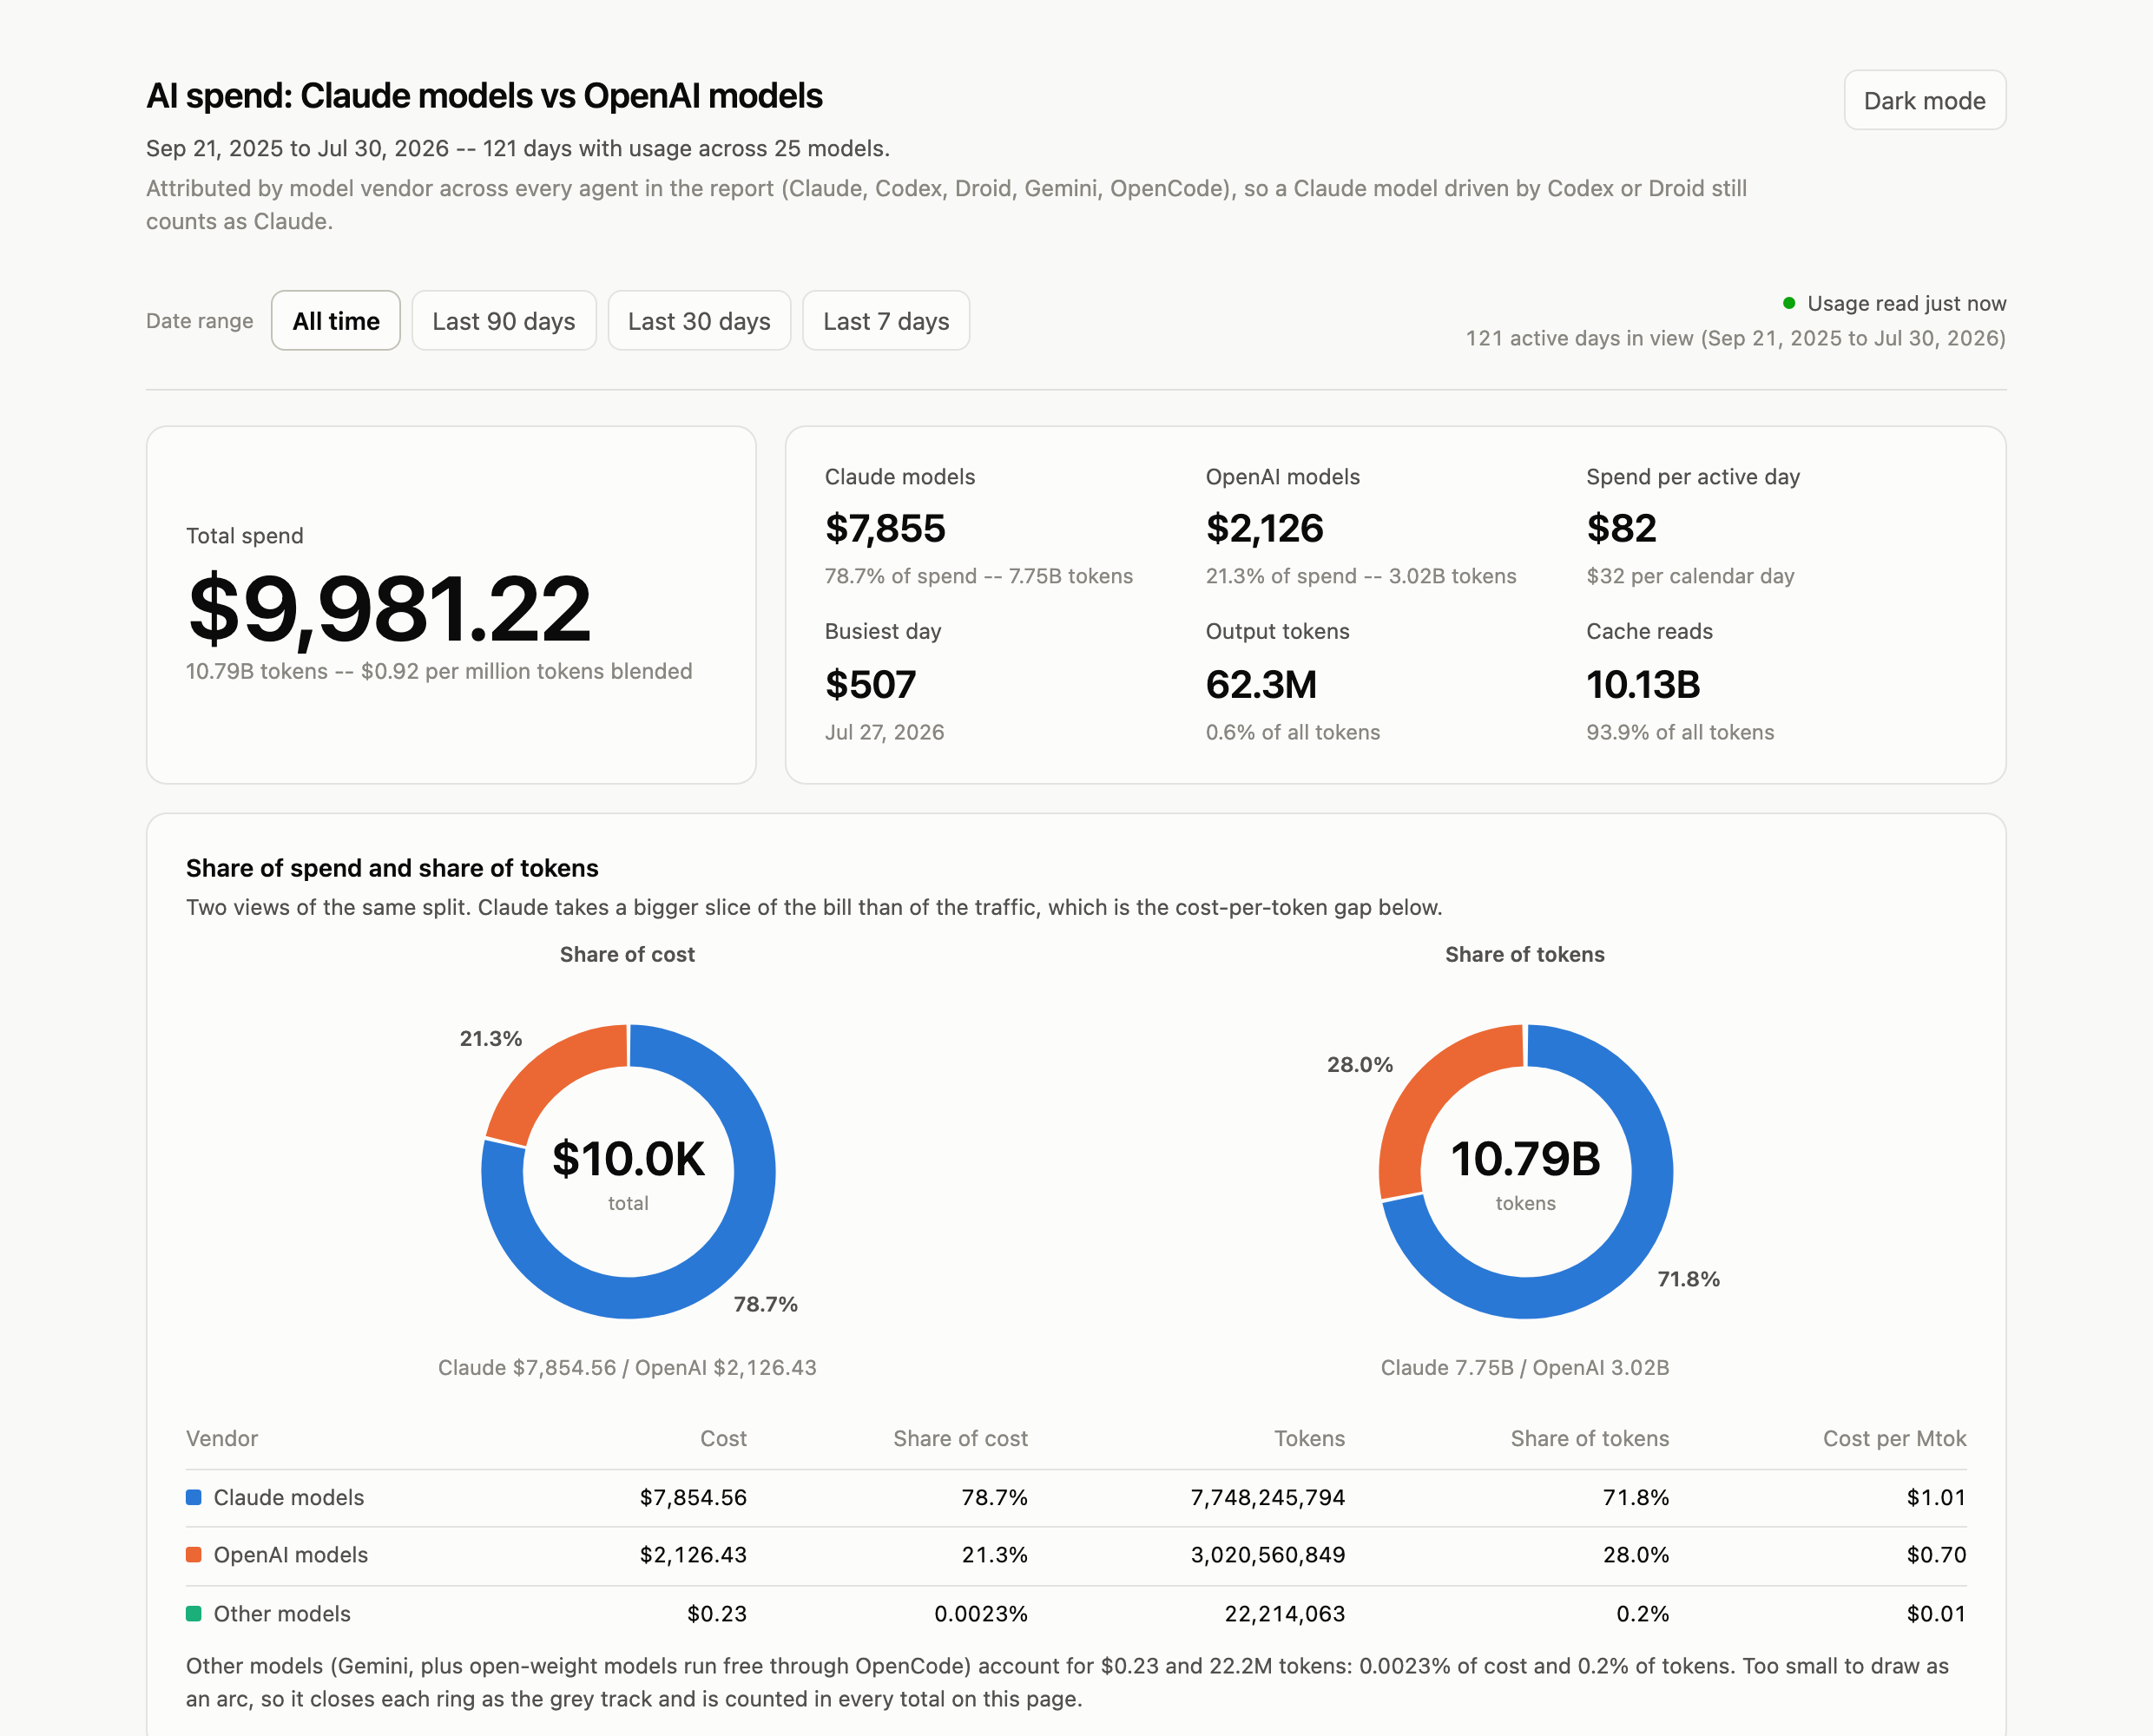
A local page with the split by vendor, cost and tokens over time, and a per-model ranking:
- Cost and token share side by side. A vendor taking 80% of the bill for 73% of the traffic is the interesting number, and one pie chart cannot show it.
- Spend and tokens per day, split by vendor, with a 7-day trailing average. Idle days are gaps rather than zeros joined by a line.
- Every model ranked by cost, with cost per million tokens so you can see which ones are expensive per unit rather than just expensive in total.
- Date range presets that rescope everything at once, and table views with exact figures behind every chart.
Light and dark, keyboard accessible, readable on a phone.
Prefer the terminal:
$ usagecc print

  AI spend   usage read just now

                  cost     share    tokens   $/Mtok
  Claude     $7,832.49     78.8%     7.71B    $1.02
  OpenAI     $2,102.66     21.2%     2.98B    $0.70
  -------------------------------------------------
  Total      $9,935.37              10.72B    $0.93

  last 7 days  $1,363.11   last 30 days  $5,855.21   per active day  $82.11
  121 active days, Sep 21 2025 to Jul 30 2026

  top models   Opus 4.8 $2,966.90   Fable 5 $1,826.39   GPT-5.5 $1,408.83
Usage
Run it without installing anything:
npx usagecc                  # open the dashboard in your browser
npx usagecc print            # print a summary in the terminal
npx usagecc build page.html  # write a standalone HTML file you can open any time
npx usagecc json             # print the summary as JSON, for piping somewhere else
Or install it once:
npm install -g usagecc
usagecc
bunx usagecc works the same way. The command is also available as aiusage, if that
reads better to you.
| Flag | What it does |
|---|---|
| --port <n> | port for the dashboard (default 4477, walks up if taken) |
| --host <addr> | bind address (default 127.0.0.1) |
| --no-open | do not open a browser |
| --version | print the version |
How the numbers work
Attribution is by model vendor, not by CLI. A Claude model driven by Codex or Droid counts as Claude, because the question is what the model costs, not which terminal you typed in.
One denominator everywhere. Every figure is attributed to a named model, so the shares on a chart, in a table and in the terminal always add to the same total. Where the underlying data carries tokens no model claims, that number is reported in the footer rather than quietly absorbed.
The same model under two names is one row. Agents disagree on spelling -- one reports
gpt-5-3-codex where another reports gpt-5.3-codex. They are folded together.
Costs are estimates. They come from local logs, priced per model. For subscription plans this is what the usage would have cost at API rates, not what you were billed.
The dashboard is a snapshot with its data inlined, and it says how old that data is in the
top right. Running usagecc re-reads the logs, so a reload is always current.
Data source
Usage data comes from ccusage, which does the work of
finding and parsing what each agent writes to disk. usagecc is the visual layer on top of
it. If your agent is missing from the report, that is the project to look at.
Requirements
Node 18.17 or newer.
Developed and tested on macOS. There is no platform-specific code beyond opening your browser, so Linux and Windows should work -- but they are untested, and a report either way is welcome.
License
MIT