
v2-charts
v0.1.21
Published
基于 Vue2 和 ECharts 封装的组件库
Maintainers
 tanshangbiao
Readme
v2-charts
基于 Vue2 和 ECharts5 封装的组件。通过组件属性配置试,进一步的解决图表配置繁琐的问题,使代码看起来更加的清晰简洁。
简介
组件介绍:
<charts/>基础组件,主要用于生成布局和图表。<charts-legend/>图例组件,主要用于生成图表的图例, 配置项 。<charts-series/>图表类型组件,主要用于生成各种不同的图表,配置项 。<charts-title/>标题组件,主要用于生成图表标题,配置项 。<charts-tooltip/>提示框组件,主要用于生成图表的提示框,配置项 。<charts-x-axis/>x轴组件,主要用于生成直角坐标系图表的x轴,配置项 。<charts-y-axis/>y轴组件,主要用于生成直角坐标系图表的y轴,配置项 。
安装
npm i --save v2-charts或
yarn i --save v2-charts使用
- 引用
import V2Charts from 'v2-charts'

Vue.use(V2Charts)- 示例
<template>
  <charts width="500px" height="500px">
    <charts-title text="这是一个饼图示例" left="center"/>
    <charts-legend orient="vertical" left="left"/>
    <charts-tooltip trigger="item" />
    <charts-series
       type="pie"
       name="访问来源"
       radius="50%"
       :data="pieData"
       :label="{
          formatter (item) {
            return `${item.name}\n ${item.value}`
          }
       }"
    />
  </charts>
</template>

<script>
export default {
  name: "charts-demo",
  data() {
    return {
      pieData: [
        { value: 1048, name: "搜索引擎" },
        { value: 735, name: "直接访问" },
        { value: 580, name: "邮件营销" },
        { value: 484, name: "联盟广告" },
        { value: 300, name: "视频广告" },
      ]
    }
  }
}
</script>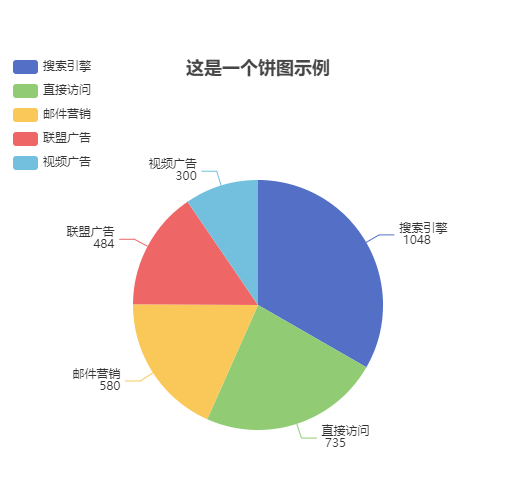
属性
Charts 组件Props
| 参数 | 说明 | 类型 | 默认值 | | ---------------- | ------------------------------------------------------------ | ------- | --------- | | width | 图表整体宽度 | String | 300px | | height | 图表整体高度 | String | 300px | | loading | 加载状态 | Boolean | false | | loadingText | 加载状态文本 | String | 加载中... | | empty | 空状态 | Boolean | false | | emptyText | 空状态文本 | String | 暂无数据 | | autoSelect | 图表项自动选中 | Boolean | false | | chartExpandAttrs | 图表拓展属性,请参考官网 配置项 | Object | 无 | | preventRender | 自定义渲染 | Boolean | false |
Charts 组件 Event
| 名称 | 说明 | 回调参数 | | ---------------- | ------------------------------------------------------------ | --------- | | on-render | 获取echarts实例对象 | charts |