
v8scope
v0.2.1
Published
A maintained Rust-first replacement for Clinic.js

Maintainers
 ryan-yang125
Readme
V8Scope



A maintained, Rust-first replacement for Clinic.js. Diagnose Node.js CPU, memory, event-loop, and async problems with one native CLI, standard V8 profiles, self-contained reports, running-process attachment, and CI performance budgets.
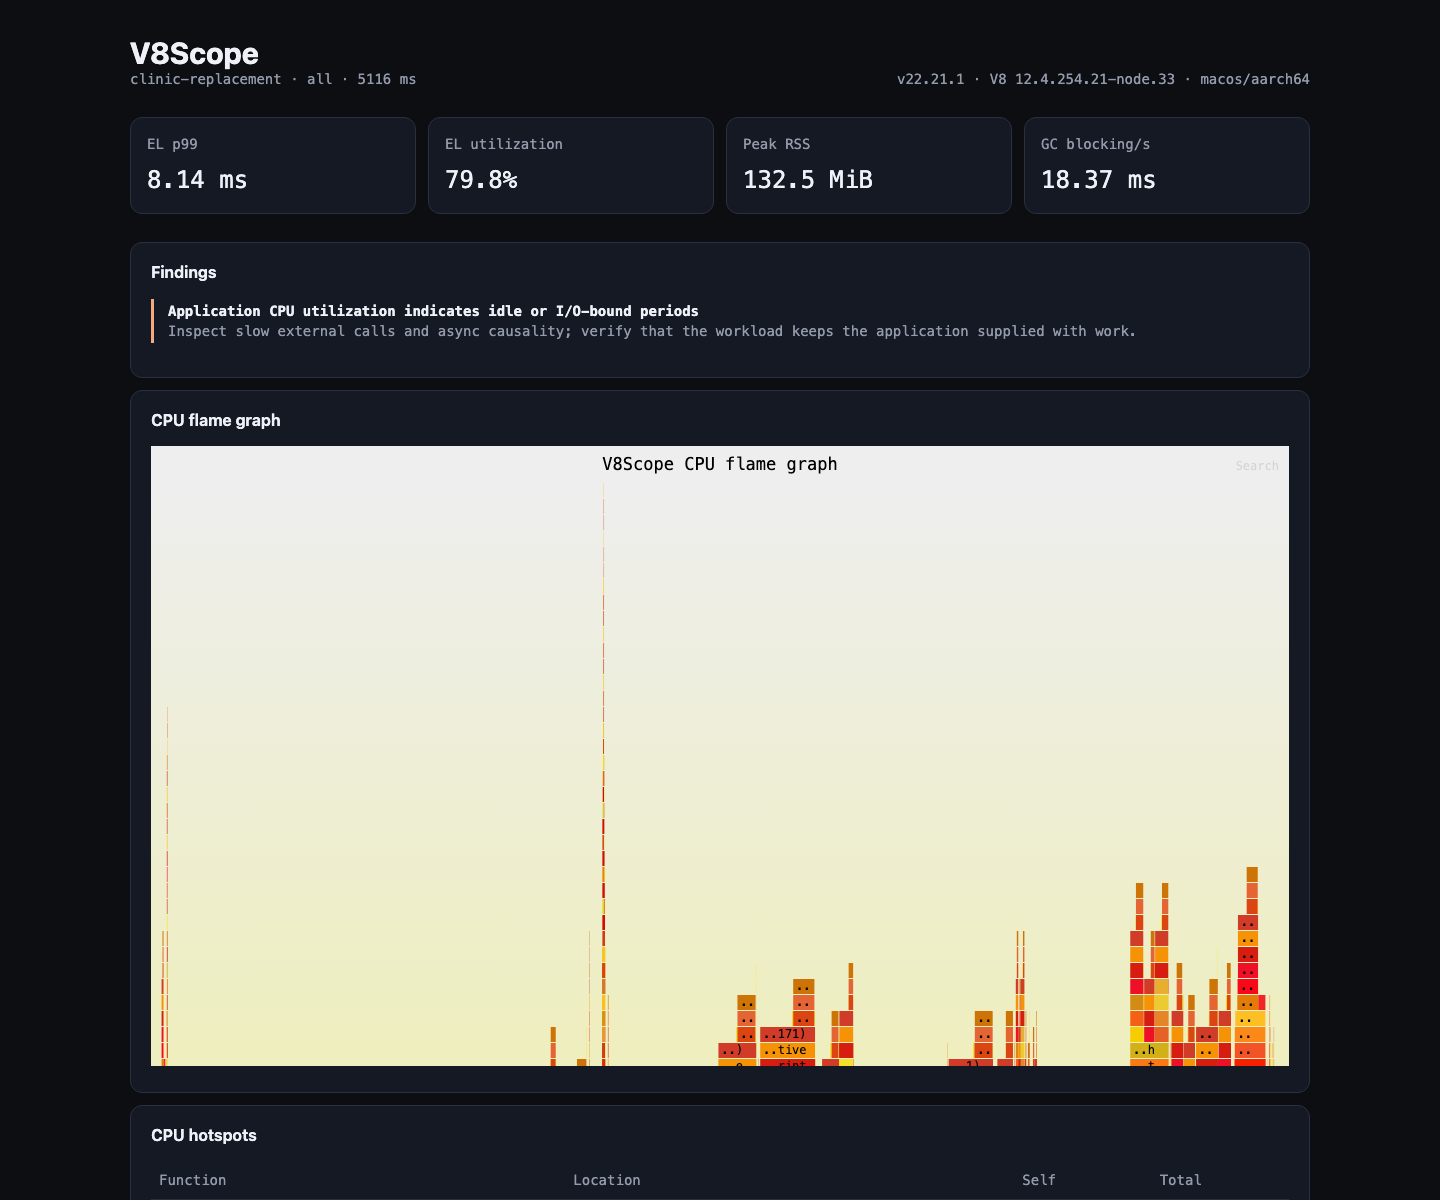
Clinic.js now carries an upstream maintenance warning about compatibility and accuracy as Node internals change. V8Scope keeps V8 inside Node and builds on stable Node profiler flags, performance APIs, and the Inspector protocol. Rust owns process containment, analysis, artifact integrity, comparison, and reporting.
V8Scope is an independent project. It is unaffiliated with NearForm and the Clinic.js maintainers.
Start here
npm install --global v8scope
v8scope diagnose -- node server.js
Open the generated report:
v8scope diagnose --duration 30s --open -- node server.jsReplace Clinic.js commands
| Clinic.js workflow | V8Scope command | Result |
| --- | --- | --- |
| clinic doctor -- node server.js | v8scope diagnose -- node server.js | CPU, event-loop, GC, memory, and resource diagnosis |
| clinic flame -- node server.js | v8scope cpu -- node server.js | V8 CPU profile, ranked hotspots, and flame graph |
| clinic heapprofiler -- node server.js | v8scope heap -- node server.js | V8 sampling heap profile and allocation hotspots |
| clinic bubbleprof -- node server.js | v8scope async -- node server.js | Async topology, causal chains, wait time, and callback time |
| Run four tools separately | v8scope all -- node server.js | Every collector in one run |
| clinic TOOL --visualize-only DATA | v8scope analyze RUN_DIR | Rebuild summary and offline report |
The migration guide maps Clinic options, workload automation, artifacts, exit codes, and integration boundaries.
Why V8Scope
| Capability | Clinic.js 13.0.0 | V8Scope |
| --- | --- | --- |
| Maintenance policy | Upstream README warns that the project is not actively maintained | Active Node versions are tested in CI and every release gate |
| Node versions | README declares Node >=16 | Node 22, 24, and 26 |
| Diagnostic workflows | Doctor, Flame, Heap Profiler, Bubbleprof | Direct command replacements plus combined all mode |
| Attach to a live process | No documented workflow | CPU and heap profiling through Node Inspector |
| Raw profiles | Clinic-specific capture directories | Standard .cpuprofile and .heapprofile files for DevTools and Speedscope |
| Automation contract | CLI and JavaScript module APIs | CLI, versioned JSON, JSON Schema, and stable exit codes |
| Performance regression gates | No built-in comparison contract | Fail-closed TOML budgets through v8scope compare |
| Artifact integrity | No published hash inventory | Exact file size and SHA-256 inventory |
| Reports | Browser report | Self-contained offline HTML with no remote scripts |
| Prebuilt platforms | npm CLI | macOS arm64, macOS x64, and Linux x64 native binaries |
See the full comparison for evidence, limitations, and the current Node failure modes covered by V8Scope's tests.
Install
npm
npm install --global v8scopeHomebrew
brew tap Ryan-yang125/tap
brew trust --formula Ryan-yang125/tap/v8scope
brew install v8scope
Shell installer
curl --proto '=https' --tlsv1.2 -LsSf \
  https://github.com/Ryan-yang125/v8scope/releases/latest/download/v8scope-installer.sh | sh
Build from source
cargo install --git https://github.com/Ryan-yang125/v8scope --lockedPrebuilt releases support macOS arm64, macOS x64, and Linux x64. Node.js 22, 24, or 26 is required.
Drive a repeatable workload
v8scope all \
  --ready-url http://127.0.0.1:3000/health \
  --load-url http://127.0.0.1:3000/api/items \
  --connections 20 \
  --rate 200 \
  --load-duration 30s \
  -- node server.js
Use --on-ready 'your load command' to run wrk, Autocannon, a test suite, or another workload after readiness succeeds. Workload processes and their descendants are contained and settled before artifact finalization.
Async causality uses async_hooks, records bounded lifecycle events, separates resource wait from callback execution, and builds an interactive aggregate topology. Its instrumentation adds measurable overhead, so async and all fit focused captures.
Attach to a running process
node --inspect=127.0.0.1:9229 server.js
v8scope attach \
  --url http://127.0.0.1:9229 \
  --mode all \
  --duration 30s \
  --open
V8Scope accepts Inspector discovery HTTP URLs and direct WebSocket URLs. Remote endpoints require --allow-remote-inspector. The Inspector target identifier is excluded from the manifest.
Enforce performance budgets
Copy v8scope.toml.example to v8scope.toml, capture baseline and candidate runs with the same collector and environment, then compare them:
v8scope compare .v8scope/baseline .v8scope/candidate --config v8scope.tomlExit code 0 means the budgets pass, 10 means a budget failed, and 70 means the runs are invalid or incomparable. Comparability requires finished, complete runs with matching collectors, mode, Node major, V8 major, OS, and architecture. Every configured metric and artifact hash is validated before budgets run.
Real benchmark
The checked-in Ubuntu x64 benchmark separates Rust control-plane performance from the target Node application's throughput. It publishes every raw sample, exact versions, quartiles, report outcomes, process-tree memory, and npm production surface.
On the dedicated Ubuntu 24.04 x64 VPS with Node 22.22.0:
| Rust control plane | Clinic.js 13.0.0 | V8Scope npm command | Released Rust binary | | --- | ---: | ---: | ---: | | CLI startup median | 219.1 ms | 46.7 ms (4.7× faster) | 6.4 ms (34.2× faster) | | Offline report rebuild median | 2274.4 ms | 278.1 ms (8.2× faster) | 244.9 ms (9.3× faster) | | Report rebuild peak RSS | 182.7 MiB | 54.7 MiB (3.3× lower) | 7.6 MiB (24.2× lower) | | Installed production tree | 96.1 MB / 17,909 files | 17.6 MB / 85 files | same installed tree | | npm dependency nodes / audit findings | 693 / 24 | 3 / 0 | no Node/npm runtime |
Startup uses 30 measurements; report rebuilding uses 10 fresh copies of each tool's equivalent five-second diagnosis capture. V8Scope processed a larger report input in this run: 288.4 KB versus Clinic's 112.3 KB. Input copying is excluded from timing. The public npm launcher includes its Node platform-selection wrapper; the native row isolates the released Rust executable.
| Collection workflow | Report success (V8Scope / Clinic) | Finalize median (V8Scope / Clinic) | Incremental RSS over baseline (V8Scope / Clinic) | | --- | ---: | ---: | ---: | | Doctor / Diagnose | 10/10 / 10/10 | 0.43 s / 2.08 s | 69.5 / 142.7 MiB | | Flame / CPU | 10/10 / 0/10 | 0.43 s / 32.01 s | 70.0 / 151.7 MiB | | Heap Profiler / Heap | 10/10 / 0/10 | 0.21 s / 30.01 s | 64.9 / 82.7 MiB | | Bubbleprof / Async | 10/10 / 6/10 | 3.95 s / 7.78 s | 517.9 / 431.2 MiB |
Clinic Flame and Heap Profiler completed the five-second load but timed out while building all 10 reports. V8Scope completed 40/40 reports with no surviving process groups. Async remains the measured tradeoff: V8Scope completed reports and handled 36.6% more requests while using 20% more incremental memory.
The control-plane run uses v0.2.0. The collection run records v0.1.1; v0.2.0 changed package positioning and CLI description while leaving every collector unchanged. The control-plane samples, collection samples, and methodology are public. Diagnose, CPU, and Heap throughput distributions overlap the baseline, confirming low collection overhead. JavaScript execution speed remains governed by Node/V8. Run the harness against your application before capacity planning.
Artifacts
Each run is self-contained:
manifest.json
summary.json
comparison.json
telemetry.ndjson
process.ndjson
profiles/cpu/*.cpuprofile
profiles/heap/*.heapprofile
profiles/async/events.ndjson
report/index.html
report/assets/cpu-flamegraph.svgmanifest.json, summary.json, and comparison.json use versioned schemas. Generate JSON Schema with v8scope schema. Absolute project paths are redacted from analyzed output by default; raw V8 profiles can still contain file names, function names, source locations, URLs, and runtime values. Every mutating command refreshes the exact file inventory, byte counts, and SHA-256 hashes.
Scope
The public contract starts at V8Scope schema version 1. New captures use the V8Scope CLI and artifact layout. Existing Clinic private data, JavaScript module APIs, report DOM integrations, and Windows workflows remain Clinic-specific.
Validation
The test baseline pins five Clinic repositories at exact commits, reconstructs all 141 executable upstream test paths, and maps every replacement capability to named Rust tests. CI also exercises real Node launch, worker and cluster profiles, Inspector attachment, signal cleanup, readiness, load, artifact integrity, and performance comparison.
Read the 141-test baseline and architecture for the complete traceability and V8/CDP decisions.
Contributing
See CONTRIBUTING.md, the security policy, and the Clinic migration issue template. Releases are built by GitHub Actions with checksums, CycloneDX SBOMs, and GitHub attestations, then published automatically to GitHub Releases, npm through trusted publishing, and Homebrew.
License
MIT. See NOTICE.md for upstream research, attribution, and third-party licenses.