
vue-chart-map
v0.1.3
Published
VueJS Map Chart


Readme
Vue Chart Map
A Vue JS Component for displaying dynamic data on a world map.
Credits
- Most of this code is copied from https://github.com/Ghrehh/vue-world-map
- Most of this code is also copied from https://github.com/maguayo/vue-map-chart
- Github : https://github.com/ronael/vue-map-chart
- Map SVG amCharts
- Lang support i18n-iso-countries
Installation
Install via npm using npm install vue-chart-map
import MapChart from 'vue-chart-map'Usage
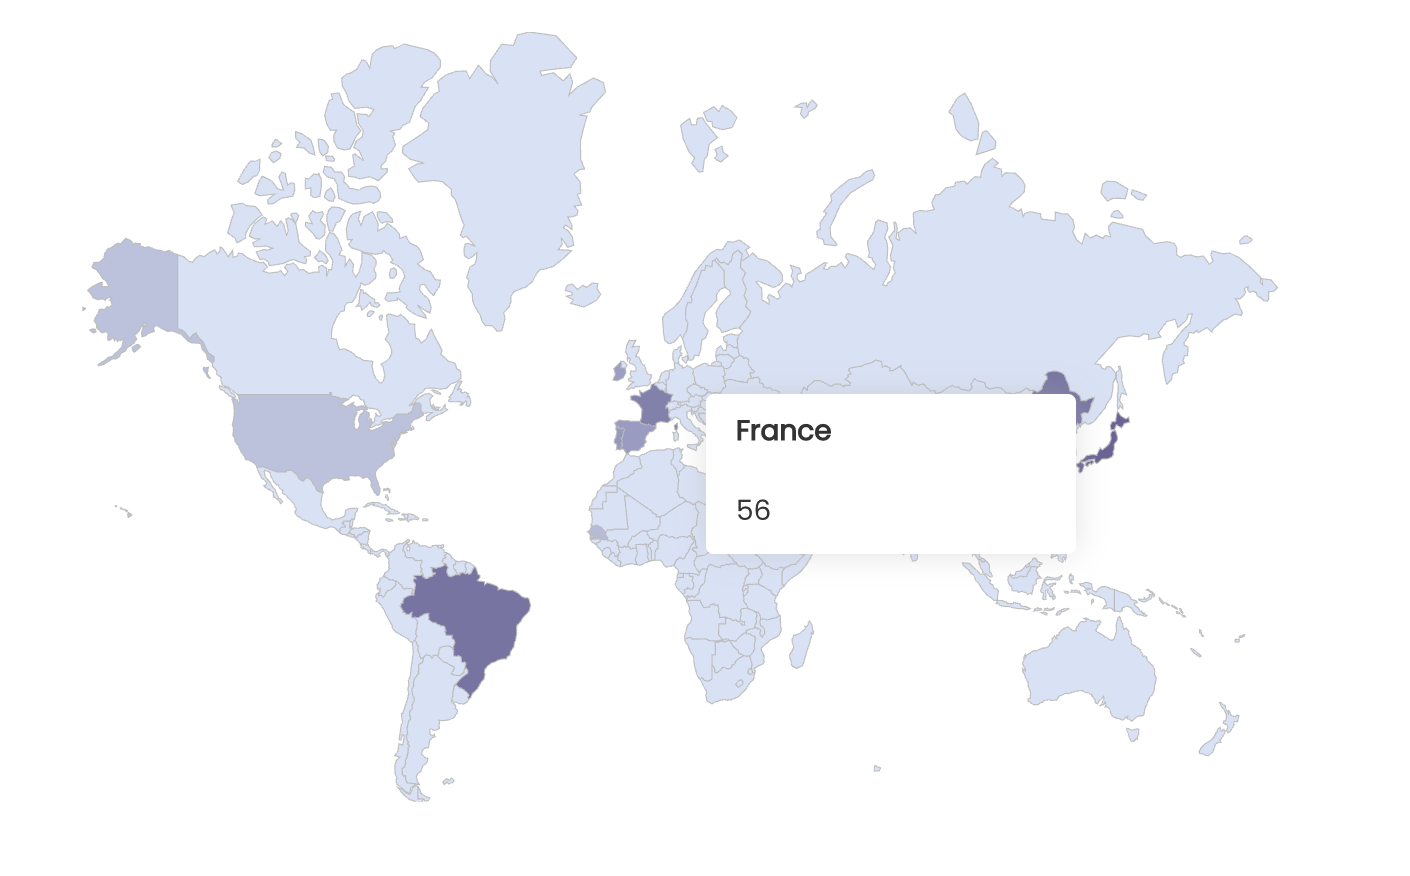
This component is most useful in creating a heat map for various countries. And will color countries differently based on a props passed.
The component requires a prop of countryData to be passed to it, which is a JS
object formatted like so.
{
  "US": 100,
  "CA": 120,
  "GB": 400,
}
Where the key is a country's ISO 3166 Code and the value is a numerical value associated with it.
Example:
import MapChart from 'vue-map-chart'

<MapChart
  :countryData="{'US': 4, 'CA': 7, 'GB': 8, 'IE': 14, 'ES': 21}"
  highColor="#ff0000"
  lowColor="#aaaaaa"
  countryStrokeColor="#909090"
  defaultCountryFillColor="#dadada"
  LangUser="fr"
  />
API
| Props | Description | Optional |Type| | --- | --- | --- |--- | | countryData | See Usage Section above for details | no | Object | | lowColor | Countries with lower values will be colored more strongly with this color | yes | String| | highColor | Countries with higher values will be colored more strongly with this color | yes | String| | defaultCountryFillColor | Countries with no data will default to this color | yes |String | | countryStrokeColor | The color of the border around countries | yes | String| | legendBorderColor | The color of the legend's border | yes | String| | legendBorderRadius | The radius of the legend's border | yes |Number| | legendHeaderBackgroundColor | The background color of the legend's header | yes |String| | legendContentBackgroundColor | The background color of the legend's content | yes |String| | legendFontColorHeader | The font color of the legend's header | yes |String| | legendFontColorContent | The font color of the legend's content | yes |String| | positionLeftTooltip | Choose the left position of the tooltip in relation to the mouse, like 3 or -13 | yes |Number| | positionTopTooltip | choose the Top position of the tooltip in relation to the mouse, like 3 or -13 | yes |Number| | legendBorderCss | Add CSS box-shadow property example: "1px solid #fff" | yes |String| | legendBoxShadowCss | Add CSS border property example: "0px 0px 15px #fff" | yes |String| | showLegend | (WIP) If true, when you select a country a legend will appear on the screen | WIP |Boolean| | showEmptyValue | If false, does not display the countries in hover, if no value is passed for this country in countryData | yes |Boolean| | LangUser | Change the language of the names of countries with an ISO code like "fr", default is "en" | yes |String| | currencyAdd | If you want to add currency to your values like 2.45 -> $2.45 | yes |Boolean| | currencyOnlySign | If you only want the currency sign in the other like lang 2.45 $US -> 2.45$ | yes |Boolean| | currencyCurrent | If you want to change the currency (ISO 4217) lang 2.45 $ -> 2.45 € | yes |String|
Roadmap
- Change Map type (World, Europe, single country, etc...) (WIP)
- Click events
- More customization
- Export PDF/CSV