
webcharts
v1.11.6
Published
A library for creating flexible, interactive charts
Downloads
1,351


Readme
![]()

Overview
Webcharts is a charting library built on top of D3.js that offers a simple way to create reusable, flexible, interactive charts with JavaScript. Charts can be customized with a handful of settings and extended through callback functions. Webcharts can also create sets of controls that are tied to charts to dynamically manipulate chart data, appearance, or behavior.
For a detailed description of the framework, see the Webcharts - A Web-based Charting Library for Custom Interactive Data Visualization in the Journal of Open Research Software. Full API documentation is in the wiki.
How to Use
Webcharts can be used in modern browsers (Chrome, Firefox, IE9+, etc.) and also exports itself as a CommonJS module for compatibility with Node. Install the package via npm:
npm install --save webchartsThen, use it in your modules:
var webCharts = require('webcharts');

// or, in ES6:
import webCharts from 'webcharts';
To use Webcharts in the browser, just make sure to include a reference to D3 first:
<script type='text/javascript' src='http://d3js.org/d3.v3.min.js'></script>
<script type='text/javascript' src='webcharts.js'></script>
Webcharts can also be used with an AMD module loader like Require.js:
require.config({
  paths: {
    webCharts: 'webcharts'
  }
});

require(['webCharts'], function(webCharts) {
   console.log(webCharts.version);
   // make some charts!
});
Making a Chart
A chart is created with a call to webCharts.createChart, a function that takes a few arguments and returns an object that represents a chart:
// define a configuration object
var settings = {
    max_width: 500,
    x: {
        label: 'Protein (g)',
        type: 'linear',
        column: 'Protein (g)'
    },
    y: {
        label: 'Carbs (g)',
        type: 'linear',
        column: 'Carbo(g)'
    },
    marks: [
        {
            type: 'circle',
            per: ['Food'],
            tooltip: '[Food]'
        }
    ],
    aspect: 1.0,
    gridlines:' xy'
};

// create the chart using the configuration above
// the chart will be rendered in the <body> element
var myChart = webCharts.createChart('body', settings);

// pass some data to the chart's init() method
// d3.csv is used to load data from a csv
d3.csv('/path/to/calories.csv', function(error,csv) {
    myChart.init(csv);
});
The first argument, 'body', tells the function where to draw the chart. This is a simple CSS selector, so it may reference a DOM element name (like in this example) or target and id or class attribute, like '.chart-wrapper'.
The second argument is a configuration object that sets a number of options for the chart. The config object in this example sets some basic options like what dataset fields should be mapped to the x and y axes, what type of marks should be drawn, how wide the chart can get (max_width), its aspect ratio, and where gridlines should be drawn. All of the possible configuration options are described here.
The chart object returned by webCharts.createChart can then be initialized by passing data to the chart via its init() method. This method is the first in a chain of a set of lifecycle methods which create necessary DOM elements, define internal charting variables, manipulate data, and then render the chart via SVG.
Behold! The code above will produce a chart like this:
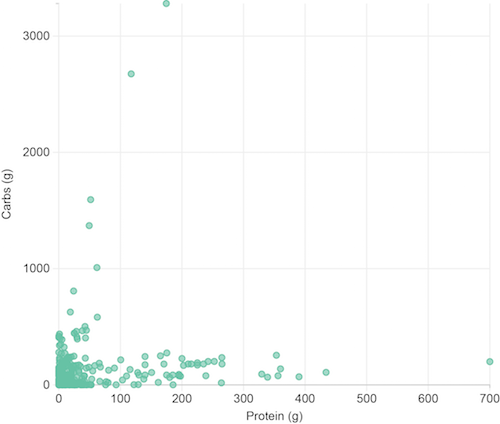
To see the real thing and look more closely at the code, check out this gist.