
webgis-maps
v1.0.38
Published
前端WebGIS统一Map地图模型库,目前主要增加了对leaflet和mapbox地图框架的支持, 通过typescript技术实现js模型的抽象定义,最后对外暴露API,使得用户拿到API就可以很轻松的上手使用leaflet和mapbox各种炫酷的地图交互。
Maintainers
 appleyk
Readme
webgis-maps
相关文章地址:webgis-maps通用地图框架库(leaflet+mapbox)
1. 介绍
本模块是一个前端 WebGIS 通用地图框架模型库,目前初步支持 Leaflet 和 Mapbox 两款主流地图引擎的部分 API 功能。基于 TypeScript 对地图相关的业务逻辑进行抽象建模,封装了日常开发中高频使用的地图操作接口,有效减少了地图交互功能的重复编码,显著提升了开发效率。同时,通过统一的 API 设计降低了开发者对特定地图框架(如 XXX)的学习成本和技术门槛。
version:1.0.38-20251021更新:
- 对Layer业务类增加参数minNativeZoom和maxNativeZoom(适配leaflet):
export default abstract class Layer {
  ................
  /** 瓦片源可用的最小缩放数。如果指定,所有缩放级别小于 minNativeZoom 的图块将根据 minNativeZoom 的缩放级别进行加载并自动缩放。*/
  minNativeZoom: number;
  /** 瓦片源可用的最大缩放数。如果指定,所有缩放级别高于 maxNativeZoom 的图块将根据 maxNativeZoom 的缩放级别进行加载并自动缩放。*/
  maxNativeZoom: number;
}
用法(设置以下两个属性时,可以确保缩放极值超过图层服务自身的极值时地图瓦片绘制不至于空白,即请求404):
let layerUrl = "https://xxxx/xxxx/tile/service/view?l={z}&y={y}&x={x}";
let layer = new LeafletTileLayer("YourLayerName", layerUrl);
layer.setMinNativeZoom(3);
layer.setMaxNativeZoom(16);
version:1.0.35-2025815更新:
- 对mapbox构建style的builder类进行重写,可基于链式调用构建最终的style,操作一气呵成,重写后使用如下:
import React, { useEffect, useState } from "react";
import "./index.scss";
import {
MapBoxLayer,
MapBoxLayerLayout,
MapBoxLayerPaint,
MapBoxMap,
MapBoxSource,
MapBoxStyle,
MapBoxStyleBuilder,
} from "../../../src";
import MapBoxLayerTypeConsts from "../../../src/model/mapbox/consts/MapBoxLayerTypeConsts";
import MapBoxSourceConsts from "../../../src/model/mapbox/consts/MapBoxSourceConsts";
const MapView = () => {
const [map, setMap] = useState(null);
useEffect(() => {
initMap();
}, []);
const initMap = () => {
initMapBoxMap();
};
const initMapBoxMap = () => {
let vectorServiceId = "sampleDataVec";
let vectorUrl =
"http://10.x.x.x:8866/xx-xx-xx/sample/data/vectortile?crs=EPSG:3857&l={z}&x={x}&y={y}&cache=false&useTolerance=false";
let rasterServiceId = "arcgis";
let rasterUrl =
"https://server.arcgisonline.com/arcgis/rest/services/World_Imagery/MapServer/tile/{z}/{y}/{x}";
let style = new MapBoxStyleBuilder()
.config("mapbox-style", {
sprite: "http://10.x.x.x:8866/xx-xx-xx/xxx/data/sprite",
})
.addSource(vectorServiceId, vectorUrl, {
type: MapBoxSourceConsts.SOURCE_TYPE_VECTOR,
minzoom: 3,
maxzoom: 18,
scheme: "xyz",
})
.addSource(rasterServiceId, rasterUrl, {
type: MapBoxSourceConsts.SOURCE_TYPE_RASTER,
minzoom: 3,
maxzoom: 18,
scheme: "xyz",
})
.addLayer(rasterServiceId, MapBoxLayerTypeConsts.RASTER, rasterServiceId)
.addLayer(
vectorServiceId,
MapBoxLayerTypeConsts.SYMBOL,
vectorServiceId,
{
sourceLayer: vectorServiceId,
layout: {
iconAllowOverlap: true,
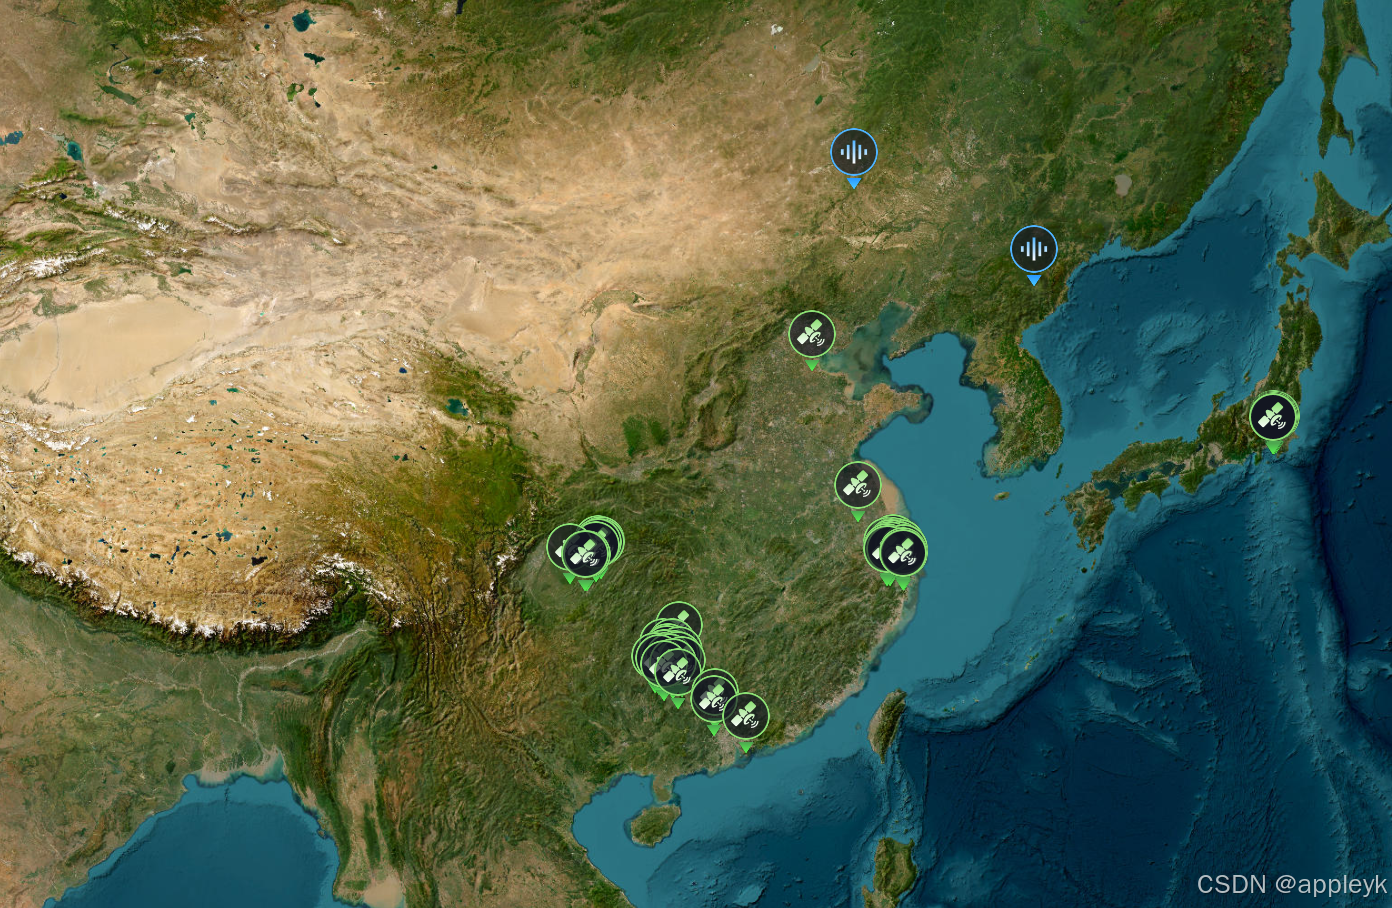
iconImage: [
"match",
["get", "dataType"],
["光学遥感影像"],
"ors",
["无人机"],
"unv",
["SAR"],
"sar",
["图片"],
"image",
["视频"],
"video",
["音频"],
"sound",
"ors",
],
iconSize: 1,
},
}
);
/** 初始化mapbox地图对象 */
let mapBoxMap = new MapBoxMap("map", style.build());
mapBoxMap.addNavigationControl(MapBoxMap.CONTROL_POSITION_TOP_LEFT);
mapBoxMap.addAttribution(MapBoxMap.CONTROL_POSITION_BOTTOM_RIGHT);
setMap(mapBoxMap.getMap());
console.log("style.buildOrigin : "+style.buildOrigin());
};
return <div id="map" className="container"></div>;
};
export default MapView;
最终效果如下:
version:1.0.34-2025813更新:
- LeafletVectorLayer对应的Canvas和Svg瓦片渲染,对于自定义Icon超出瓦片部分进行特殊处理--》丢弃
version:1.0.30-20250314更新:
- LeafletGeoJsonLayer构造器新增bMask参数,对于单面的geojsonData进行遮罩处理,默认false,代码如下:
/**
   * LeafletGeojsonLayer构造器
   * @param id 图层字符串ID
   * @param data 图层geojson字符串数据
   * @param style 图层样式函数
   * @param pane 图层面板容器名称
   * @param bMask 是否为当前数据源构建遮罩效果
   */
  constructor(
    id: string,
    data: any,
    style: StyleFunction,
    pane: string = "",
    bMask = false
  ) {
    super(id, undefined, pane);
    if (bMask) {
      let outerRing = [
        [-180.0, 85.5],
        [180.0, 85.5],
        [180.0, -85.5],
        [-180.0, -85.5],
      ];
      if (data.geometry) {
        if (data.geometry.type === "MultiPolygon") {
          let features = data.geometry.coordinates[0];
          features.unshift(outerRing);
        } else if (data.geometry.type === "Polygon") {
          let features = data.geometry.coordinates;
          features.unshift(outerRing);
        }
      } else {
        if (data.type === "MultiPolygon") {
          let features = data.coordinates[0];
          features.unshift(outerRing);
        } else if (data.type === "Polygon") {
          let features = data.coordinates;
          features.unshift(outerRing);
        }
      }
      this.data = data;
    } else {
      this.data = data;
    }
    this.style = style;
  }
测试数据:
{
  "type": "Polygon",
  "coordinates": [
    [
      [117.28583099, 31.59835657],
      [117.3010303, 31.59604101],
      [117.30770317, 31.58151486],
      [117.28286527, 31.57909361],
      [117.28583099, 31.59835657]
    ]
  ]
}
代码案例:
// 引入数据
import geom from "../geom.json";
// 图层样式
const dataStyles = (feature) => {
  return {
    fillColor: "#000",
    stroke: true,
    fillOpacity: 0.5,
    color: "blue",
    weight: 2,
  };
};
// 构建地图对象
let leftMap = new LeafletMap("map",{ zoomControl: false },14,[31.59835657, 117.28583099]);
// 构建geojsonLayer
let geosjonLayer = new LeafletGeojsonLayer("geojson", geom, dataStyles,"",true);
leftMap.addLayer(geosjonLayer);
展示效果如下:

version:1.0.28-20250314更新:
- AbstractMap地图抽象类新增getLayer方法,用于获取指定layerId的图层对象。
2. 使用
2.1 依赖项
该模块依赖于leaflet和mapbox-gl库,推荐版本如下:
"@types/leaflet": "^1.9.12",
"@types/mapbox-gl": "^2.7.8",
"leaflet": "^1.7.1",
"mapbox-gl": "^2.12.0",
2.2 安装
由于该模块还在不断完善中,npm仓库提交的版本会很频繁,如有检测到最新版本,建议先移除旧版本,然后再安装新版本。
yarn remove webgis-maps && yarn add webgis-maps2.3 axios封装
axios简单封装如下(以下只是参考,主要为了配合该模块做的封装,具体情况基于实际开发环境来):
request.js
import axios from "axios";

const apiService = axios.create({
  timeout: 60 * 1000,
});

const axiosFn = {
  // get请求
  commonOnGet: (url, params = {}, headers = {}) => {
    return apiService.get(url, {
      params: params,
      headers: headers,
    });
  },
};

export {apiService,axiosFn};
2.3 leaflet使用案例
index.jsx (初始化路由组件)
import React from "react";
import MapView from "../pages/map-view/MapView";
import {Switch } from "antd";
import { useState } from "react";
import { axiosFn } from "../request";

const switchStyle = {
  position: "absolute",
  top: "50px",
  right: "280px",
  zIndex: 9999999999,
  borderRadius: "3px",
};

const spanStyle = {
    position: "absolute",
    top: "50px",
    right: "200px",
    zIndex: 9999999999,
    borderRadius: "3px",
    fontSize:"15px",
    color:"white"
  };

const MapIndex = (props) => {
  const [showGrid, setShowGrid] = useState(false);
  const onChange = () => {
    setShowGrid(!showGrid);
  };
  return (
    <div className="App">
      <MapView showGrid={showGrid} />
      <Switch
        style={switchStyle}
        checkedChildren="开启"
        unCheckedChildren="关闭"
        defaultChecked
        onChange={onChange}
      >
      </Switch>
      <span style={spanStyle}>经纬线网格</span>
    </div>
  );
};

export default MapIndex;
mapview.css(MapView组件的样式)
.container {
  width: 100%;
  height: 100%;
  position: absolute;
  overflow: hidden;
  left: 0;
  top: 0;
}
MapView.jsx(地图视图组件)
import React, { Component } from "react";
import {
LeafletMap, // LeafLet地图模型类
LeafletDrawLonlatLine, // LeafLet经纬网格插件类
LeafletTileLayer,// LeafLet栅格瓦片图层
OgcXmlParser,// ogc服务能力解析类
LeafletWmtsLayer,// LeafLet·wmts图层
} from "webgis-maps";
import { axiosFn } from "../../request";
import "./mapview.css";
export default class MapView extends Component {
constructor(props) {
super(props);
}
componentDidMount() {
this.initMap();
}
componentWillUnmount() {
/**释放资源,移除经纬线相关图层和地图事件*/
this.lonLatGridLines.removeDrawEvent();
}
initMap() {
/** 构建LeafletMap对象*/
const leafletMap = new LeafletMap("map", { zoomControl: false },[30.3634,107.33643]);
/** 获取LeafletMap对象中的map对象(leaflet api中的map实例)*/
let map = leafletMap.getMap();
/** 添加自定义的缩放控件,默认屏幕位置:topleft */
leafletMap.addZoomSlider();
/** 添加自定义的缩放层级显示span功能,默认屏幕位置:topleft */
leafletMap.addZoomLable();
/** 添加鼠标滑过动态显示经纬度span功能,默认屏幕位置:bottomright */
leafletMap.addMousePosition();
/** arcgis xyz服务类型的地址 */
let arcgisXYZ = "https://server.arcgisonline.com/arcgis/rest/services/World_Imagery/MapServer/tile/{z}/{y}/{x}";
/** 构建leaflet栅格瓦片图层对象 */
let arcgisLayer = new LeafletTileLayer("arcgis", arcgisXYZ);
/** 将栅格瓦片图层添加到leafletMap中 */
leafletMap.addLayer(arcgisLayer);
let suzhouWMTS = "http://10.16.248.40:8080/tile/service/wmts/1572457472291904/0";
/** 解析wmts服务(比如:范围、图层、样式、分辨率、瓦片变化矩阵等) */
axiosFn
.commonOnGet(OgcXmlParser.getWmtsCapabilitiesUrl(suzhouWMTS))
.then((res) => {
/** 获取wmts服务能力xml描述 */
let xmlData = res.data;
/** 获取wmts服务图层的配置项 */
let options = OgcXmlParser.getWmtsOptions(xmlData);
/** 获取wmts服务的范围 */
let fitBounds = OgcXmlParser.getFitBounds(xmlData)
/** 地图定位到wmts服务所在的范围 */
map.fitBounds(fitBounds)
/** 构建wmts图层 */
let suzhouWMTSLayer = new LeafletWmtsLayer("suzhou", suzhouWMTS);
/** 设置wmts图层的配置项 */
suzhouWMTSLayer.setWmtsOptions(options);
/** 将wmts图层添加到leafletMap中 */
leafletMap.addLayer(suzhouWMTSLayer);
});
/** leaflet·wms服务图层与wmts图层类似!!! */
/**以下仅是额外扩展的leaflet插件功能*/
this.lonLatGridLines = new LeafletDrawLonlatLine(map);
/**经纬线设置为红色*/
this.lonLatGridLines.setLineColor("red");
/**经纬线度数文本颜色调整为黄色*/
this.lonLatGridLines.setTextColor("yellow");
/**经纬线度数文本四个方位(东西南北)均显示*/
this.lonLatGridLines.setTextPosition("all");
}
/**展示经纬格网图层*/
doShowGrid(showGrid) {
if (!this.lonLatGridLines) {
return;
}
if (showGrid) {
/** 添加绘制地图事件(即拖动地图时,清除上一次的图层的同时绘制新的图层)*/
this.lonLatGridLines.addDrawEvent();
/** 初始化话的时候,触发一次绘制*/
this.lonLatGridLines.drawLonlatTileGrid();
} else {
this.lonLatGridLines.removeDrawEvent();
}
}
render() {
let { showGrid } = this.props;
this.doShowGrid(showGrid);
return <div id="map" className="container"></div>;
}
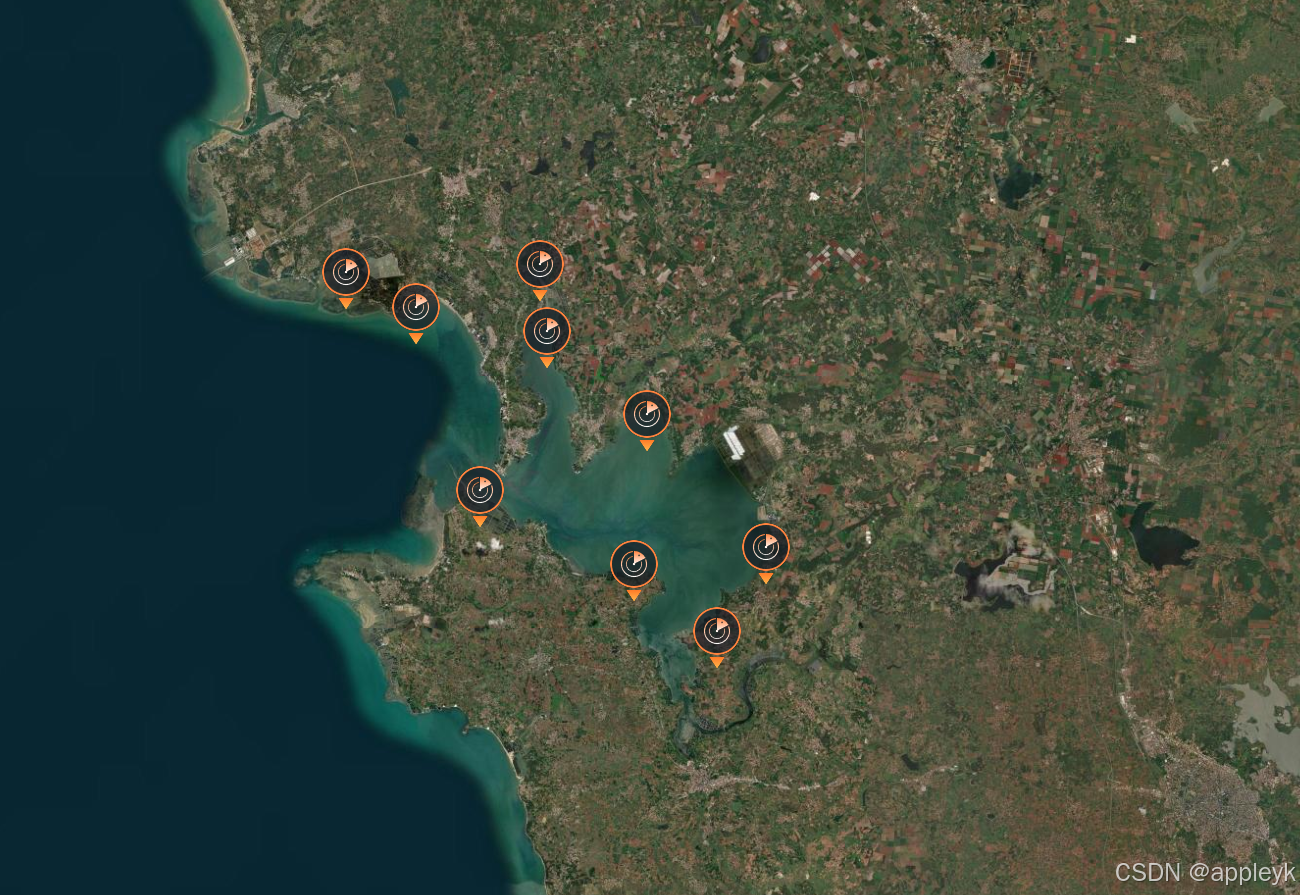
}3. 最终效果图
